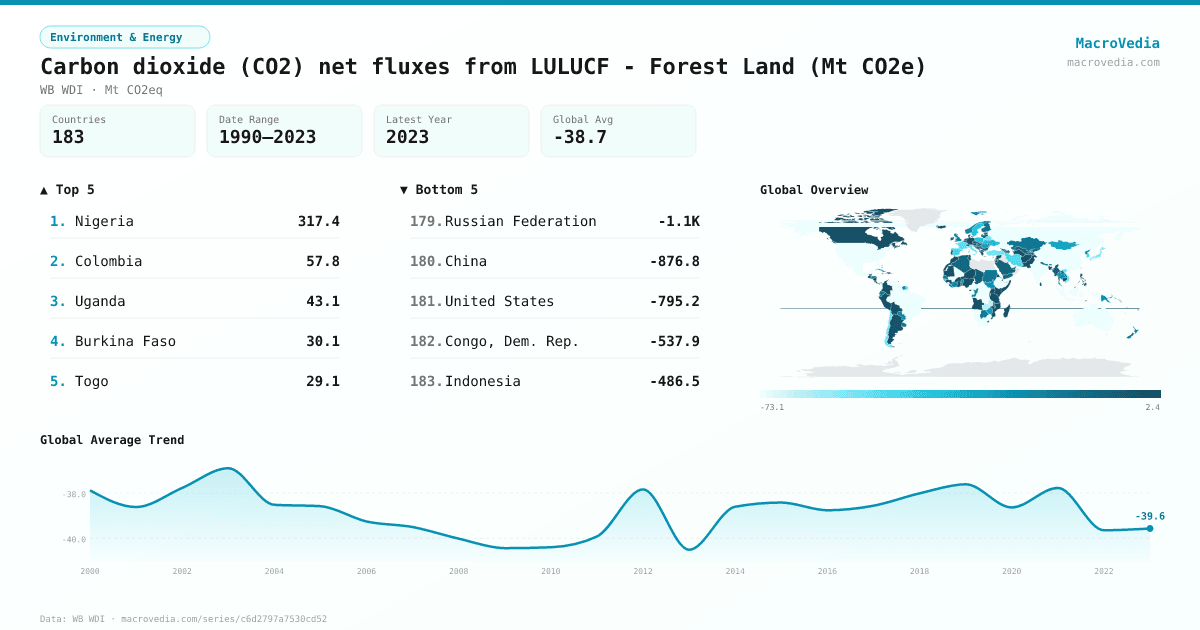
Carbon dioxide (CO2) net fluxes from LULUCF - Forest Land (Mt CO2e)
Environment & EnergyWB WDIwb_wdi:EN.GHG.CO2.LU.FL.MT.CE.AR5•Mt CO2eq•1990 → 2023•183 countries
Series quick facts
High-level context for this country series.
Environment & EnergyWB WDI
Coverage
183
Frequency
yearly
Range
1990 \u2192 2023
Latest
2023
Carbon dioxide (CO2) net fluxes from LULUCF - Forest Land (Mt CO2e) by country
Latest available value per country (as of 2023)
Low \u2192 High
Unit: Mt CO2eq
≤ -51.35
-51.35 – -18.02
-18.02 – -5.82
-5.82 – -2.12
-2.12 – -0.59
-0.59 – 0
> 0
No data
Generated by MacroVedia.comSource: World Bank (WB WDI)
Highest 15 countries
Carbon dioxide (CO2) net fluxes from LULUCF - Forest Land (Mt CO2e)
50 countries with data
Generated by MacroVedia.comSource: World Bank (WB WDI)
Distribution across countries
Carbon dioxide (CO2) net fluxes from LULUCF - Forest Land (Mt CO2e)
Countries
50
Median
0
Mean
12.6
25th pctl
-0.1
75th pctl
7
Generated by MacroVedia.comSource: World Bank (WB WDI)
Compare trends
Carbon dioxide (CO2) net fluxes from LULUCF - Forest Land (Mt CO2e)
NigeriaColombiaUganda
Generated by MacroVedia.comSource: World Bank (WB WDI)
| Country | Latest | Date | Trend |
|---|---|---|---|
| NigeriaNGA | 317.38 Mt CO2eq | 2023 | |
| ColombiaCOL | 57.8 Mt CO2eq | 2023 | |
| UgandaUGA | 43.07 Mt CO2eq | 2023 | |
| Burkina FasoBFA | 30.13 Mt CO2eq | 2023 | |
| TogoTGO | 29.09 Mt CO2eq | 2023 | |
| PakistanPAK | 24.86 Mt CO2eq | 2023 | |
| CanadaCAN | 20.31 Mt CO2eq | 2023 | |
| GermanyDEU | 17.47 Mt CO2eq | 2023 | |
| GuatemalaGTM | 16.94 Mt CO2eq | 2023 | |
| Solomon IslandsSLB | 15.87 Mt CO2eq | 2023 | |
| GuineaGIN | 14.6 Mt CO2eq | 2023 | |
| BoliviaBOL | 9.82 Mt CO2eq | 2023 | |
| AngolaAGO | 7 Mt CO2eq | 2023 | |
| PeruPER | 6.28 Mt CO2eq | 2023 | |
| Equatorial GuineaGNQ | 5.18 Mt CO2eq | 2023 | |
| AustriaAUT | 5.14 Mt CO2eq | 2023 | |
| LesothoLSO | 4.87 Mt CO2eq | 2023 | |
| AfghanistanAFG | 4.03 Mt CO2eq | 2023 | |
| KenyaKEN | 2.68 Mt CO2eq | 2023 | |
| NicaraguaNIC | 1.25 Mt CO2eq | 2023 | |
| HaitiHTI | 0.78 Mt CO2eq | 2023 | |
| FijiFJI | 0.56 Mt CO2eq | 2023 | |
| AndorraAND | 0.14 Mt CO2eq | 2023 | |
| KuwaitKWT | 0.13 Mt CO2eq | 2023 | |
| MonacoMCO | 0 Mt CO2eq | 2020 | |
| MadagascarMDG | 0 Mt CO2eq | 2020 | |
| MozambiqueMOZ | 0 Mt CO2eq | 2023 | |
| TuvaluTUV | 0 Mt CO2eq | 2023 | |
| TanzaniaTZA | 0 Mt CO2eq | 2020 | |
| MaltaMLT | -0 Mt CO2eq | 2023 | |
| San MarinoSMR | -0.01 Mt CO2eq | 2023 | |
| LiechtensteinLIE | -0.02 Mt CO2eq | 2023 | |
| BahrainBHR | -0.03 Mt CO2eq | 2023 | |
| Syrian Arab RepublicSYR | -0.04 Mt CO2eq | 2023 | |
| BarbadosBRB | -0.05 Mt CO2eq | 2023 | |
| St. Vincent and the GrenadinesVCT | -0.06 Mt CO2eq | 2023 | |
| Antigua and BarbudaATG | -0.06 Mt CO2eq | 2023 | |
| SingaporeSGP | -0.07 Mt CO2eq | 2023 | |
| PalauPLW | -0.1 Mt CO2eq | 2023 | |
| Cabo VerdeCPV | -0.11 Mt CO2eq | 2023 | |
| St. Kitts and NevisKNA | -0.14 Mt CO2eq | 2023 | |
| GrenadaGRD | -0.18 Mt CO2eq | 2023 | |
| CyprusCYP | -0.19 Mt CO2eq | 2023 | |
| EritreaERI | -0.21 Mt CO2eq | 2023 | |
| St. LuciaLCA | -0.22 Mt CO2eq | 2023 | |
| IsraelISR | -0.26 Mt CO2eq | 2023 | |
| SeychellesSYC | -0.29 Mt CO2eq | 2023 | |
| BangladeshBGD | -0.45 Mt CO2eq | 2023 | |
| NigerNER | -0.51 Mt CO2eq | 2023 | |
| ArmeniaARM | -0.53 Mt CO2eq | 2023 |
Source: World Bank (WB WDI)