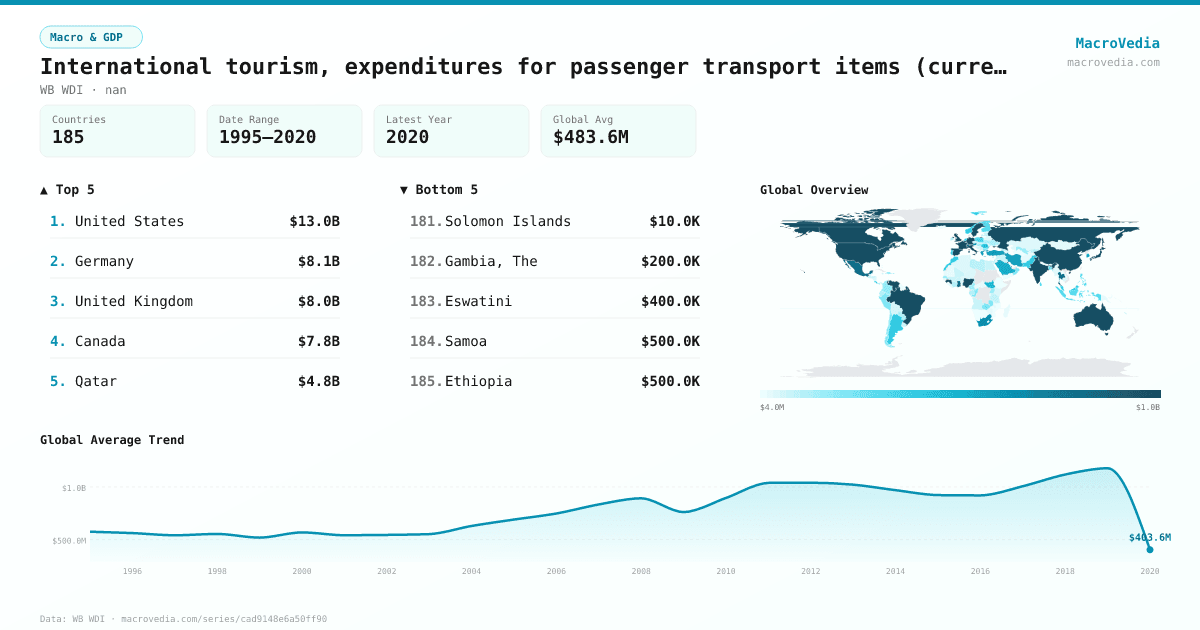
International tourism, expenditures for passenger transport items (current US$)
Macro & GDPWB WDIwb_wdi:ST.INT.TRNX.CD•nan•1995 → 2020•185 countries
Series quick facts
High-level context for this country series.
Macro & GDPWB WDI
Coverage
185
Frequency
yearly
Range
1995 \u2192 2020
Latest
2020
International tourism, expenditures for passenger transport items (current US$) by country
Latest available value per country (as of 2020)
Low \u2192 High
Unit: US$
≤ 10M
10M – 27.57M
27.57M – 82M
82M – 157.14M
157.14M – 467.43M
467.43M – 1.69B
> 1.69B
No data
Generated by MacroVedia.comSource: World Bank (WB WDI)
Highest 15 countries
International tourism, expenditures for passenger transport items (current US$)
50 countries with data
Generated by MacroVedia.comSource: World Bank (WB WDI)
Distribution across countries
International tourism, expenditures for passenger transport items (current US$)
Countries
50
Median
$1.92B
Mean
$3.69B
25th pctl
$1.09B
75th pctl
$3.14B
Generated by MacroVedia.comSource: World Bank (WB WDI)
Compare trends
International tourism, expenditures for passenger transport items (current US$)
GuineaGhanaUnited States
Generated by MacroVedia.comSource: World Bank (WB WDI)
| Country | Latest | Date | Trend |
|---|---|---|---|
| United StatesUSA | $52.79B | 2019 | |
| FranceFRA | $9.24B | 2019 | |
| GermanyDEU | $8.13B | 2019 | |
| United KingdomGBR | $8.01B | 1998 | |
| JapanJPN | $7.87B | 2019 | |
| CanadaCAN | $7.85B | 2011 | |
| ItalyITA | $7.6B | 2019 | |
| IndiaIND | $5.68B | 2019 | |
| AustraliaAUS | $5.38B | 2019 | |
| QatarQAT | $4.76B | 2020 | |
| Russian FederationRUS | $4.46B | 2019 | |
| BrazilBRA | $3.59B | 2019 | |
| IndonesiaIDN | $3.14B | 2019 | |
| NigeriaNGA | $2.9B | 2019 | |
| South AfricaZAF | $2.73B | 2019 | |
| ThailandTHA | $2.61B | 2019 | |
| Korea, Rep.KOR | $2.6B | 2019 | |
| MexicoMEX | $2.42B | 2019 | |
| SwitzerlandCHE | $2.34B | 2019 | |
| AustriaAUT | $2.33B | 2019 | |
| BelgiumBEL | $2.26B | 2019 | |
| IsraelISR | $2.24B | 2019 | |
| ChinaCHN | $2.21B | 2004 | |
| NetherlandsNLD | $2.07B | 2019 | |
| ArgentinaARG | $2B | 2019 | |
| SwedenSWE | $1.85B | 2010 | |
| SpainESP | $1.83B | 1998 | |
| PakistanPAK | $1.35B | 2019 | |
| MalaysiaMYS | $1.31B | 2019 | |
| Saudi ArabiaSAU | $1.28B | 2019 | |
| TurkiyeTUR | $1.24B | 2019 | |
| RomaniaROU | $1.18B | 2019 | |
| KuwaitKWT | $1.17B | 2017 | |
| NorwayNOR | $1.17B | 2019 | |
| FinlandFIN | $1.16B | 2019 | |
| GreeceGRC | $1.14B | 2019 | |
| Venezuela, RBVEN | $1.11B | 2016 | |
| PortugalPRT | $1.09B | 2019 | |
| GuineaGIN | $1.07B | 2020 | |
| Iran, Islamic Rep.IRN | $1.06B | 2017 | |
| PolandPOL | $941M | 2019 | |
| MoroccoMAR | $926M | 2019 | |
| BahrainBHR | $917M | 2019 | |
| PhilippinesPHL | $888M | 2019 | |
| PeruPER | $852.8M | 2019 | |
| GhanaGHA | $841M | 2020 | |
| Sri LankaLKA | $798M | 2019 | |
| OmanOMN | $771M | 2019 | |
| ColombiaCOL | $723M | 2019 | |
| ChileCHL | $714M | 2019 |
Source: World Bank (WB WDI)