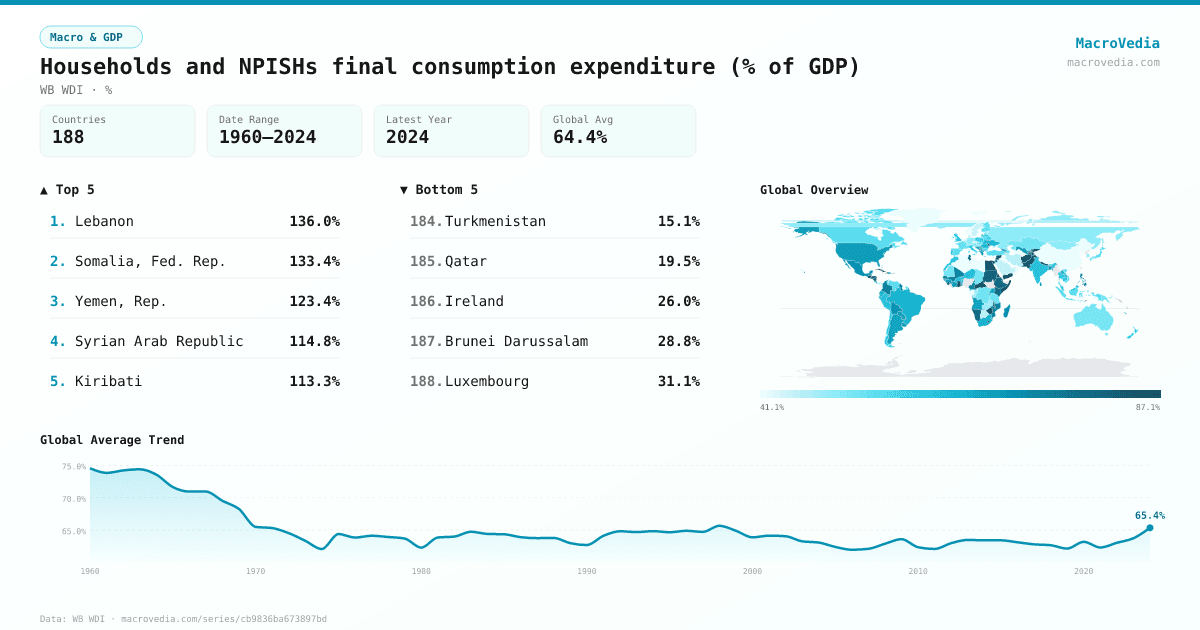
Households and NPISHs final consumption expenditure (% of GDP)
Macro & GDPWB WDIwb_wdi:NE.CON.PRVT.ZS•%•1960 → 2024•188 countries
Series quick facts
High-level context for this country series.
Macro & GDPWB WDI
Coverage
188
Frequency
yearly
Range
1960 \u2192 2024
Latest
2024
Households and NPISHs final consumption expenditure (% of GDP) by country
Latest available value per country (as of 2024)
Low \u2192 High
Unit: %
≤ 45.3%
45.3% – 52.91%
52.91% – 59.95%
59.95% – 66.82%
66.82% – 73.08%
73.08% – 83.93%
> 83.93%
No data
Generated by MacroVedia.comSource: World Bank (WB WDI)
Highest 15 countries
Households and NPISHs final consumption expenditure (% of GDP)
50 countries with data
Generated by MacroVedia.comSource: World Bank (WB WDI)
Distribution across countries
Households and NPISHs final consumption expenditure (% of GDP)
Countries
50
Median
84.6%
Mean
88.9%
25th pctl
79.3%
75th pctl
95.5%
Generated by MacroVedia.comSource: World Bank (WB WDI)
Compare trends
Households and NPISHs final consumption expenditure (% of GDP)
Central African RepublicGuatemalaEgypt, Arab Rep.
Generated by MacroVedia.comSource: World Bank (WB WDI)
| Country | Latest | Date | Trend |
|---|---|---|---|
| LebanonLBN | 136.04% | 2023 | |
| Somalia, Fed. Rep.SOM | 133.38% | 2024 | |
| Yemen, Rep.YEM | 123.4% | 2018 | |
| Syrian Arab RepublicSYR | 114.8% | 2022 | |
| KiribatiKIR | 113.25% | 2023 | |
| Micronesia, Fed. Sts.FSM | 106.29% | 1983 | — |
| ComorosCOM | 103.63% | 2024 | |
| TongaTON | 99.82% | 2023 | |
| HaitiHTI | 99.82% | 2024 | |
| EritreaERI | 98.17% | 2011 | |
| AfghanistanAFG | 98.07% | 2023 | |
| Central African RepublicCAF | 97.86% | 2024 | |
| West Bank and GazaPSE | 95.52% | 2024 | |
| LesothoLSO | 92.86% | 2023 | |
| Kyrgyz RepublicKGZ | 90.9% | 2024 | |
| CubaCUB | 90.88% | 2024 | |
| TajikistanTJK | 89.58% | 2023 | |
| GuatemalaGTM | 87.98% | 2024 | |
| Egypt, Arab Rep.EGY | 87.58% | 2024 | |
| MoldovaMDA | 86.83% | 2024 | |
| NepalNPL | 86.34% | 2024 | |
| Gambia, TheGMB | 86.24% | 2024 | |
| HondurasHND | 85.99% | 2024 | |
| MalawiMWI | 85.18% | 2023 | |
| PakistanPAK | 84.77% | 2024 | |
| ZimbabweZWE | 84.39% | 2024 | |
| GhanaGHA | 83.96% | 2024 | |
| KosovoXKX | 83.92% | 2024 | |
| Timor-LesteTLS | 83.64% | 2024 | |
| Solomon IslandsSLB | 81.92% | 2024 | |
| SudanSDN | 81.08% | 2024 | |
| PalauPLW | 80.9% | 2023 | |
| NicaraguaNIC | 80.64% | 2024 | |
| EthiopiaETH | 80.23% | 2024 | |
| Sierra LeoneSLE | 79.94% | 2024 | |
| El SalvadorSLV | 79.62% | 2024 | |
| TunisiaTUN | 79.5% | 2024 | |
| NamibiaNAM | 79.25% | 2024 | |
| MontenegroMNE | 78.93% | 2024 | |
| JordanJOR | 78.86% | 2021 | |
| KenyaKEN | 77.62% | 2024 | |
| Puerto Rico (US)PRI | 77.11% | 2024 | |
| PhilippinesPHL | 76.15% | 2024 | |
| SamoaWSM | 75.83% | 2024 | |
| VanuatuVUT | 75.39% | 2022 | |
| SeychellesSYC | 74.58% | 2024 | |
| TogoTGO | 74.51% | 2022 | |
| MozambiqueMOZ | 73.93% | 2024 | |
| French PolynesiaPYF | 73.7% | 2024 | |
| GuyanaGUY | 73.41% | 2005 |
Source: World Bank (WB WDI)