Maternal mortality ratio (modeled estimate, per 100,000 live births)
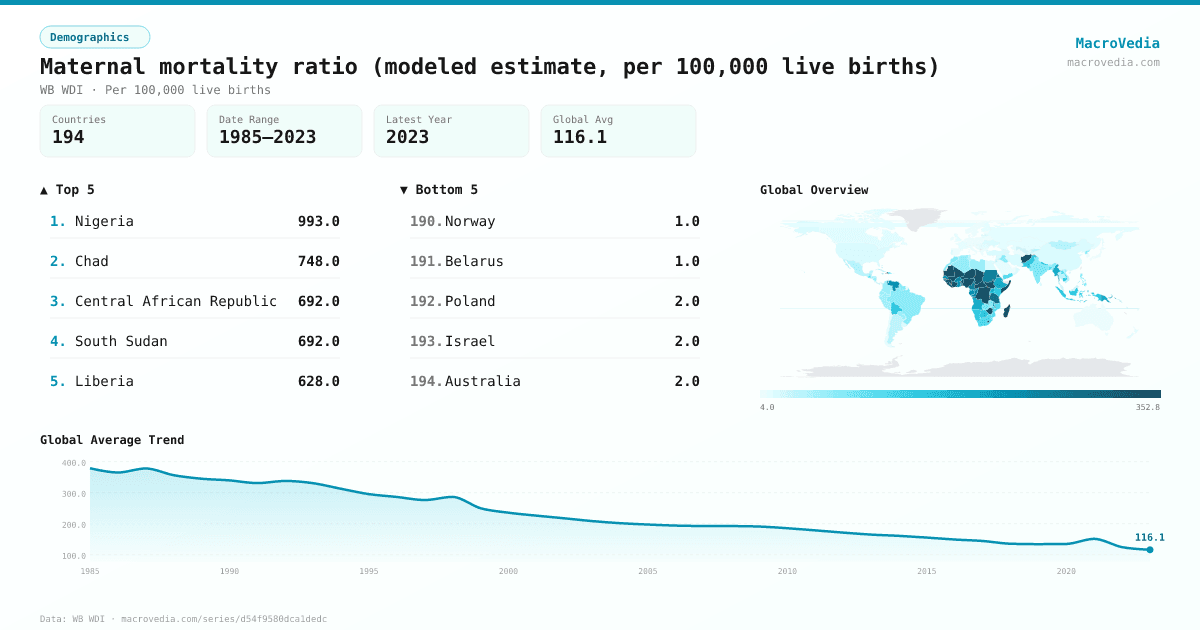
DemographicsWB WDIwb_wdi:SH.STA.MMRT•Per 100,000 live births•1985 → 2023•194 countries
Series quick facts
High-level context for this country series.
DemographicsWB WDI
Coverage
194
Frequency
yearly
Range
1985 \u2192 2023
Latest
2023
Maternal mortality ratio (modeled estimate, per 100,000 live births) by country
Latest available value per country (as of 2023)
Low \u2192 High
Unit: Per 100,000 live births
≤ 7
7 – 15.14
15.14 – 36
36 – 67
67 – 129.86
129.86 – 248
> 248
No data
Generated by MacroVedia.comSource: World Bank (WB WDI)
Highest 15 countries
Maternal mortality ratio (modeled estimate, per 100,000 live births)
50 countries with data
Generated by MacroVedia.comSource: World Bank (WB WDI)
Distribution across countries
Maternal mortality ratio (modeled estimate, per 100,000 live births)
Countries
50
Median
274.5
Mean
338.6
25th pctl
192
75th pctl
427
Generated by MacroVedia.comSource: World Bank (WB WDI)
Compare trends
Maternal mortality ratio (modeled estimate, per 100,000 live births)
NigeriaChadCentral African Republic
Generated by MacroVedia.comSource: World Bank (WB WDI)
| Country | Latest | Date | Trend |
|---|---|---|---|
| NigeriaNGA | 993 Per 100,000 live births | 2023 | |
| ChadTCD | 748 Per 100,000 live births | 2023 | |
| Central African RepublicCAF | 692 Per 100,000 live births | 2023 | |
| South SudanSSD | 692 Per 100,000 live births | 2023 | |
| LiberiaLBR | 628 Per 100,000 live births | 2023 | |
| Somalia, Fed. Rep.SOM | 563 Per 100,000 live births | 2023 | |
| AfghanistanAFG | 521 Per 100,000 live births | 2023 | |
| BeninBEN | 518 Per 100,000 live births | 2023 | |
| Guinea-BissauGNB | 505 Per 100,000 live births | 2023 | |
| GuineaGIN | 494 Per 100,000 live births | 2023 | |
| LesothoLSO | 478 Per 100,000 live births | 2023 | |
| MadagascarMDG | 445 Per 100,000 live births | 2023 | |
| Congo, Dem. Rep.COD | 427 Per 100,000 live births | 2023 | |
| BurundiBDI | 392 Per 100,000 live births | 2023 | |
| MauritaniaMRT | 381 Per 100,000 live births | 2023 | |
| MaliMLI | 367 Per 100,000 live births | 2023 | |
| Cote d'IvoireCIV | 359 Per 100,000 live births | 2023 | |
| ZimbabweZWE | 358 Per 100,000 live births | 2023 | |
| Gambia, TheGMB | 354 Per 100,000 live births | 2023 | |
| Sierra LeoneSLE | 354 Per 100,000 live births | 2023 | |
| NigerNER | 350 Per 100,000 live births | 2023 | |
| TogoTGO | 349 Per 100,000 live births | 2023 | |
| HaitiHTI | 328 Per 100,000 live births | 2023 | |
| EritreaERI | 291 Per 100,000 live births | 2023 | |
| TanzaniaTZA | 276 Per 100,000 live births | 2023 | |
| NauruNRU | 273 Per 100,000 live births | 2023 | |
| CameroonCMR | 258 Per 100,000 live births | 2023 | |
| SudanSDN | 256 Per 100,000 live births | 2023 | |
| Burkina FasoBFA | 242 Per 100,000 live births | 2023 | |
| Congo, Rep.COG | 241 Per 100,000 live births | 2023 | |
| SenegalSEN | 237 Per 100,000 live births | 2023 | |
| GhanaGHA | 234 Per 100,000 live births | 2023 | |
| GabonGAB | 233 Per 100,000 live births | 2023 | |
| RwandaRWA | 229 Per 100,000 live births | 2023 | |
| Venezuela, RBVEN | 227 Per 100,000 live births | 2023 | |
| MalawiMWI | 225 Per 100,000 live births | 2023 | |
| EthiopiaETH | 195 Per 100,000 live births | 2023 | |
| Timor-LesteTLS | 192 Per 100,000 live births | 2023 | |
| Papua New GuineaPNG | 189 Per 100,000 live births | 2023 | |
| MyanmarMMR | 185 Per 100,000 live births | 2023 | |
| AngolaAGO | 183 Per 100,000 live births | 2023 | |
| ComorosCOM | 179 Per 100,000 live births | 2023 | |
| Equatorial GuineaGNQ | 174 Per 100,000 live births | 2023 | |
| TuvaluTUV | 170 Per 100,000 live births | 2023 | |
| UgandaUGA | 170 Per 100,000 live births | 2023 | |
| DjiboutiDJI | 162 Per 100,000 live births | 2023 | |
| BotswanaBWA | 155 Per 100,000 live births | 2023 | |
| Marshall IslandsMHL | 155 Per 100,000 live births | 2023 | |
| PakistanPAK | 155 Per 100,000 live births | 2023 | |
| KenyaKEN | 149 Per 100,000 live births | 2023 |
Source: World Bank (WB WDI)