Mean weekly hours actually worked per employed person
LabourILOilostat:HOW_TEMP_SEX_ECO_NB_A•Hours•1948 → 2025•175 countries
Series quick facts
High-level context for this country series.
LabourILO
Coverage
175
Frequency
yearly
Range
1948 \u2192 2025
Latest
2024
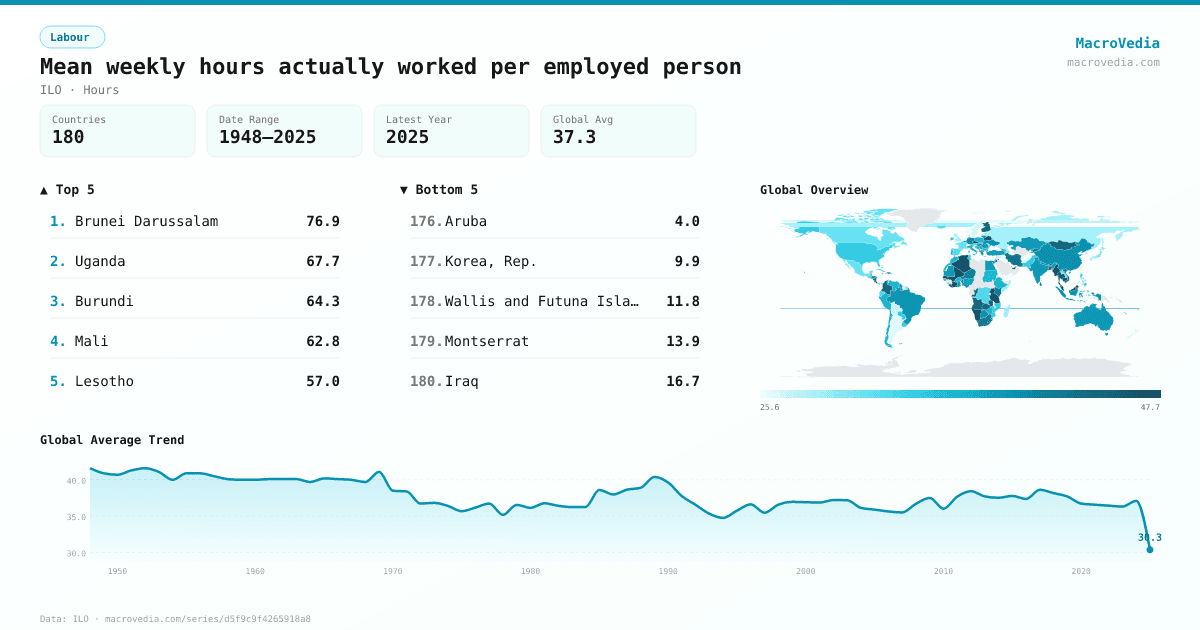
Mean weekly hours actually worked per employed person by country
Latest available value per country (as of 2024)
Low \u2192 High
Unit: Hours
≤ 29.93
29.93 – 33.98
33.98 – 36.99
36.99 – 39.18
39.18 – 41.31
41.31 – 45.01
> 45.01
No data
Generated by MacroVedia.comSource: International Labour Organization (ILO)
Highest 15 countries
Mean weekly hours actually worked per employed person
50 countries with data
Generated by MacroVedia.comSource: International Labour Organization (ILO)
Distribution across countries
Mean weekly hours actually worked per employed person
Countries
50
Median
45.1
Mean
48.2
25th pctl
42.8
75th pctl
50.5
Generated by MacroVedia.comSource: International Labour Organization (ILO)
Compare trends
Mean weekly hours actually worked per employed person
Costa RicaHong Kong SAR, ChinaCzechia
Generated by MacroVedia.comSource: International Labour Organization (ILO)
| Country | Latest | Date | Trend |
|---|---|---|---|
| Brunei DarussalamBRN | 76.94 Hours | 2024 | |
| UgandaUGA | 67.65 Hours | 2021 | |
| BurundiBDI | 64.27 Hours | 2014 | — |
| MaliMLI | 62.78 Hours | 2023 | |
| LesothoLSO | 56.99 Hours | 2024 | |
| SenegalSEN | 56.15 Hours | 2024 | |
| TanzaniaTZA | 55.74 Hours | 2024 | |
| Hong Kong SAR, ChinaHKG | 55 Hours | 2016 | |
| MalaysiaMYS | 54.4 Hours | 2022 | |
| MyanmarMMR | 53.68 Hours | 2020 | |
| NamibiaNAM | 52.72 Hours | 2018 | |
| BhutanBTN | 51.7 Hours | 2022 | |
| United Arab EmiratesARE | 50.48 Hours | 2024 | |
| Cote d'IvoireCIV | 50.18 Hours | 2019 | |
| Cayman IslandsCYM | 50 Hours | 2015 | |
| BelarusBLR | 49.57 Hours | 2024 | |
| MadagascarMDG | 49.28 Hours | 2015 | |
| Macao SAR, ChinaMAC | 49 Hours | 2016 | |
| CambodiaKHM | 48.83 Hours | 2023 | |
| LiberiaLBR | 47.54 Hours | 2017 | |
| CzechiaCZE | 47.12 Hours | 2024 | |
| AlgeriaDZA | 46.84 Hours | 2017 | |
| ThailandTHA | 45.67 Hours | 2024 | |
| Cabo VerdeCPV | 45.31 Hours | 2009 | — |
| FinlandFIN | 45.16 Hours | 2024 | |
| Congo, Rep.COG | 44.99 Hours | 2009 | — |
| Costa RicaCRI | 44.92 Hours | 2024 | |
| MaldivesMDV | 44.92 Hours | 2019 | |
| HaitiHTI | 44.76 Hours | 2012 | — |
| MongoliaMNG | 44.65 Hours | 2024 | |
| ZambiaZMB | 44.49 Hours | 2024 | |
| AngolaAGO | 44.36 Hours | 2023 | |
| BangladeshBGD | 44.3 Hours | 2024 | |
| ColombiaCOL | 43.99 Hours | 2024 | |
| EswatiniSWZ | 43.88 Hours | 2023 | |
| JamaicaJAM | 43.64 Hours | 2023 | |
| Viet NamVNM | 43.14 Hours | 2024 | |
| Iran, Islamic Rep.IRN | 42.8 Hours | 2024 | |
| Bahamas, TheBHS | 42.6 Hours | 2019 | — |
| JordanJOR | 42.4 Hours | 2023 | |
| Guinea-BissauGNB | 42.3 Hours | 2018 | — |
| BeninBEN | 42.28 Hours | 2011 | |
| South AfricaZAF | 42.25 Hours | 2024 | |
| Sri LankaLKA | 42.13 Hours | 2023 | |
| NicaraguaNIC | 41.96 Hours | 2012 | |
| KenyaKEN | 41.83 Hours | 2022 | |
| Kyrgyz RepublicKGZ | 41.72 Hours | 2023 | |
| BermudaBMU | 41.7 Hours | 2010 | |
| Micronesia, Fed. Sts.FSM | 41.49 Hours | 2014 | — |
| SingaporeSGP | 41.4 Hours | 2020 |
Source: International Labour Organization (ILO)