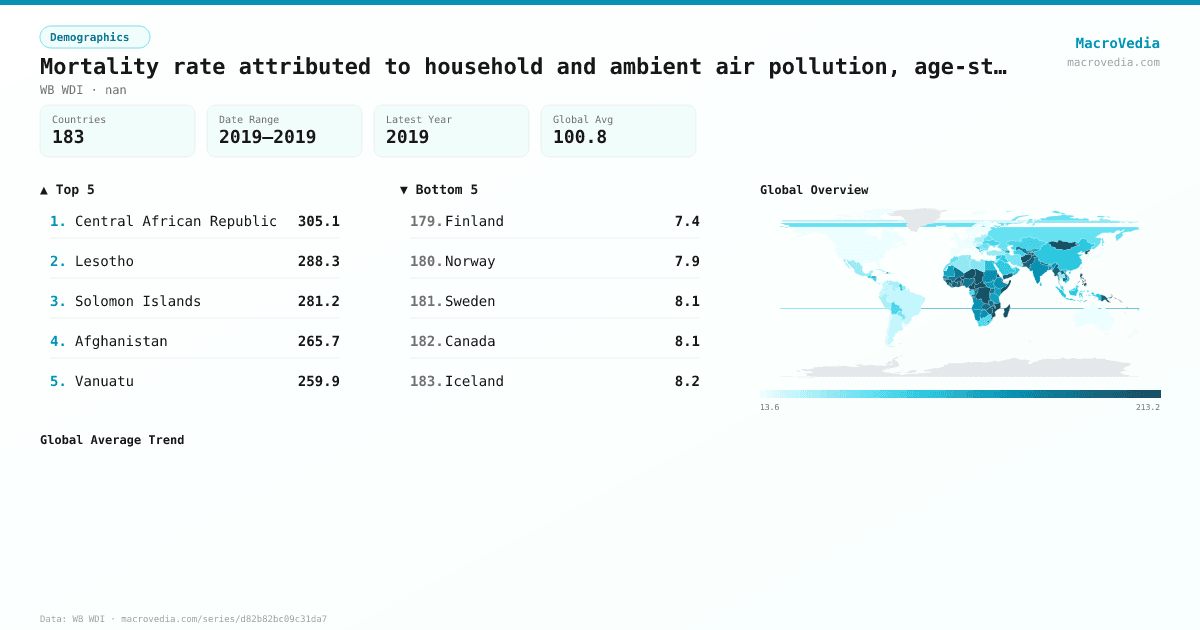
Mortality rate attributed to household and ambient air pollution, age-standardized (per 100,000 population)
DemographicsWB WDIwb_wdi:SH.STA.AIRP.P5•nan•2019 → 2019•183 countries
Series quick facts
High-level context for this country series.
DemographicsWB WDI
Coverage
183
Frequency
—
Range
2019 \u2192 2019
Latest
2019
Mortality rate attributed to household and ambient air pollution, age-standardized (per 100,000 population) by country
Latest available value per country (as of 2019)
Low \u2192 High
Unit: nan
≤ 17.5
17.5 – 37.9
37.9 – 67.1
67.1 – 95.3
95.3 – 148.5
148.5 – 202.8
> 202.8
No data
Generated by MacroVedia.comSource: World Bank (WB WDI)
Highest 15 countries
Mortality rate attributed to household and ambient air pollution, age-standardized (per 100,000 population)
50 countries with data
Generated by MacroVedia.comSource: World Bank (WB WDI)
Distribution across countries
Mortality rate attributed to household and ambient air pollution, age-standardized (per 100,000 population)
Countries
50
Median
204.9
Mean
208.5
25th pctl
184.1
75th pctl
228.4
Generated by MacroVedia.comSource: World Bank (WB WDI)
Compare trends
Mortality rate attributed to household and ambient air pollution, age-standardized (per 100,000 population)
Central African RepublicLesothoSolomon Islands
Generated by MacroVedia.comSource: World Bank (WB WDI)
| Country | Latest | Date | Trend |
|---|---|---|---|
| Central African RepublicCAF | 305.1 nan | 2019 | — |
| LesothoLSO | 288.3 nan | 2019 | — |
| Solomon IslandsSLB | 281.2 nan | 2019 | — |
| AfghanistanAFG | 265.7 nan | 2019 | — |
| VanuatuVUT | 259.9 nan | 2019 | — |
| Micronesia, Fed. Sts.FSM | 254 nan | 2019 | — |
| KiribatiKIR | 246.6 nan | 2019 | — |
| Sierra LeoneSLE | 239 nan | 2019 | — |
| GuineaGIN | 238 nan | 2019 | — |
| Somalia, Fed. Rep.SOM | 237.9 nan | 2019 | — |
| EritreaERI | 237.4 nan | 2019 | — |
| Guinea-BissauGNB | 228.8 nan | 2019 | — |
| MozambiqueMOZ | 228.4 nan | 2019 | — |
| ChadTCD | 227.4 nan | 2019 | — |
| Sao Tome and PrincipeSTP | 225.4 nan | 2019 | — |
| TogoTGO | 223.1 nan | 2019 | — |
| Gambia, TheGMB | 220.5 nan | 2019 | — |
| MongoliaMNG | 214.7 nan | 2019 | — |
| NigerNER | 213.3 nan | 2019 | — |
| Korea, Dem. People's Rep.PRK | 212.8 nan | 2019 | — |
| Congo, Dem. Rep.COD | 209.8 nan | 2019 | — |
| MadagascarMDG | 208 nan | 2019 | — |
| CameroonCMR | 206.7 nan | 2019 | — |
| HaitiHTI | 206.4 nan | 2019 | — |
| BurundiBDI | 205.9 nan | 2019 | — |
| TajikistanTJK | 203.8 nan | 2019 | — |
| PhilippinesPHL | 202.8 nan | 2019 | — |
| BeninBEN | 201.8 nan | 2019 | — |
| Burkina FasoBFA | 201.3 nan | 2019 | — |
| Lao PDRLAO | 195.3 nan | 2019 | — |
| GhanaGHA | 193.6 nan | 2019 | — |
| PakistanPAK | 192.1 nan | 2019 | — |
| Papua New GuineaPNG | 189.6 nan | 2019 | — |
| ZimbabweZWE | 189.6 nan | 2019 | — |
| Cote d'IvoireCIV | 186.5 nan | 2019 | — |
| Yemen, Rep.YEM | 186.3 nan | 2019 | — |
| Timor-LesteTLS | 185.6 nan | 2019 | — |
| MyanmarMMR | 184.1 nan | 2019 | — |
| DjiboutiDJI | 177.9 nan | 2019 | — |
| NepalNPL | 177.9 nan | 2019 | — |
| ZambiaZMB | 174 nan | 2019 | — |
| EswatiniSWZ | 173.7 nan | 2019 | — |
| Congo, Rep.COG | 170.4 nan | 2019 | — |
| MaliMLI | 167.1 nan | 2019 | — |
| RwandaRWA | 165.8 nan | 2019 | — |
| Equatorial GuineaGNQ | 165.7 nan | 2019 | — |
| NigeriaNGA | 165.2 nan | 2019 | — |
| ComorosCOM | 164.6 nan | 2019 | — |
| CambodiaKHM | 163.3 nan | 2019 | — |
| UgandaUGA | 163 nan | 2019 | — |
Source: World Bank (WB WDI)