Proportion of time spent on unpaid domestic and care work, female (% of 24 hour day)
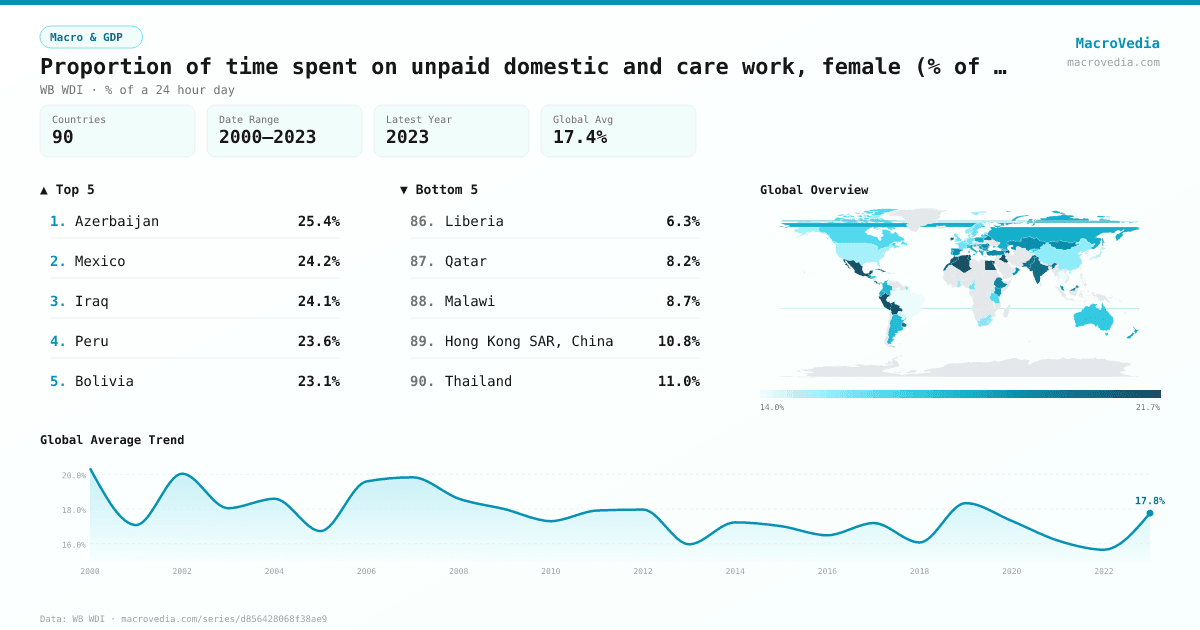
Macro & GDPWB WDIwb_wdi:SG.TIM.UWRK.FE•% of a 24 hour day•2000 → 2023•90 countries
Series quick facts
High-level context for this country series.
Macro & GDPWB WDI
Coverage
90
Frequency
—
Range
2000 \u2192 2023
Latest
2023
Proportion of time spent on unpaid domestic and care work, female (% of 24 hour day) by country
Latest available value per country (as of 2023)
Low \u2192 High
Unit: %
≤ 14.57%
14.57% – 15.59%
15.59% – 17.14%
17.14% – 18.18%
18.18% – 19.13%
19.13% – 20.63%
> 20.63%
No data
Generated by MacroVedia.comSource: World Bank (WB WDI)
Highest 15 countries
Proportion of time spent on unpaid domestic and care work, female (% of 24 hour day)
50 countries with data
Generated by MacroVedia.comSource: World Bank (WB WDI)
Distribution across countries
Proportion of time spent on unpaid domestic and care work, female (% of 24 hour day)
Countries
50
Median
19.2%
Mean
19.8%
25th pctl
18.3%
75th pctl
20.8%
Generated by MacroVedia.comSource: World Bank (WB WDI)
Compare trends
Proportion of time spent on unpaid domestic and care work, female (% of 24 hour day)
EcuadorSwitzerlandMongolia
Generated by MacroVedia.comSource: World Bank (WB WDI)
| Country | Latest | Date | Trend |
|---|---|---|---|
| AzerbaijanAZE | 25.42% | 2008 | — |
| MexicoMEX | 24.21% | 2019 | |
| IraqIRQ | 24.1% | 2007 | — |
| PeruPER | 23.56% | 2010 | — |
| BoliviaBOL | 23.12% | 2001 | — |
| Egypt, Arab Rep.EGY | 22.36% | 2015 | — |
| Costa RicaCRI | 22.15% | 2017 | — |
| TunisiaTUN | 21.94% | 2006 | — |
| AlbaniaALB | 21.74% | 2011 | — |
| AlgeriaDZA | 21.67% | 2012 | — |
| ArmeniaARM | 21.66% | 2008 | |
| CubaCUB | 21% | 2016 | |
| MoroccoMAR | 20.83% | 2012 | — |
| IrelandIRL | 20.56% | 2005 | — |
| SloveniaSVN | 20.56% | 2001 | — |
| IndiaIND | 20.35% | 2019 | — |
| El SalvadorSLV | 20.21% | 2017 | |
| West Bank and GazaPSE | 20.14% | 2013 | |
| MoldovaMDA | 20.14% | 2012 | — |
| UruguayURY | 19.87% | 2013 | |
| PakistanPAK | 19.86% | 2007 | — |
| GuatemalaGTM | 19.48% | 2017 | |
| EthiopiaETH | 19.31% | 2013 | — |
| SerbiaSRB | 19.17% | 2015 | |
| BelarusBLR | 19.17% | 2015 | — |
| TurkiyeTUR | 19.15% | 2015 | |
| MalaysiaMYS | 19.1% | 2003 | — |
| MongoliaMNG | 19.06% | 2023 | |
| RomaniaROU | 19.03% | 2012 | |
| SpainESP | 18.96% | 2010 | |
| KazakhstanKAZ | 18.96% | 2018 | |
| MauritiusMUS | 18.96% | 2003 | — |
| OmanOMN | 18.89% | 2008 | |
| MaltaMLT | 18.75% | 2002 | — |
| KenyaKEN | 18.7% | 2021 | — |
| BulgariaBGR | 18.47% | 2010 | |
| LatviaLVA | 18.26% | 2003 | — |
| PolandPOL | 18.26% | 2013 | |
| EcuadorECU | 18.19% | 2017 | |
| GreeceGRC | 18.13% | 2014 | — |
| New ZealandNZL | 18.06% | 2010 | — |
| Russian FederationRUS | 18% | 2019 | — |
| PanamaPAN | 17.95% | 2011 | — |
| ItalyITA | 17.92% | 2014 | |
| PortugalPRT | 17.81% | 2015 | — |
| GeorgiaGEO | 17.79% | 2021 | — |
| ColombiaCOL | 17.64% | 2021 | |
| ArgentinaARG | 17.5% | 2010 | |
| SwitzerlandCHE | 17.31% | 2020 | |
| HondurasHND | 17.3% | 2009 | — |
Source: World Bank (WB WDI)