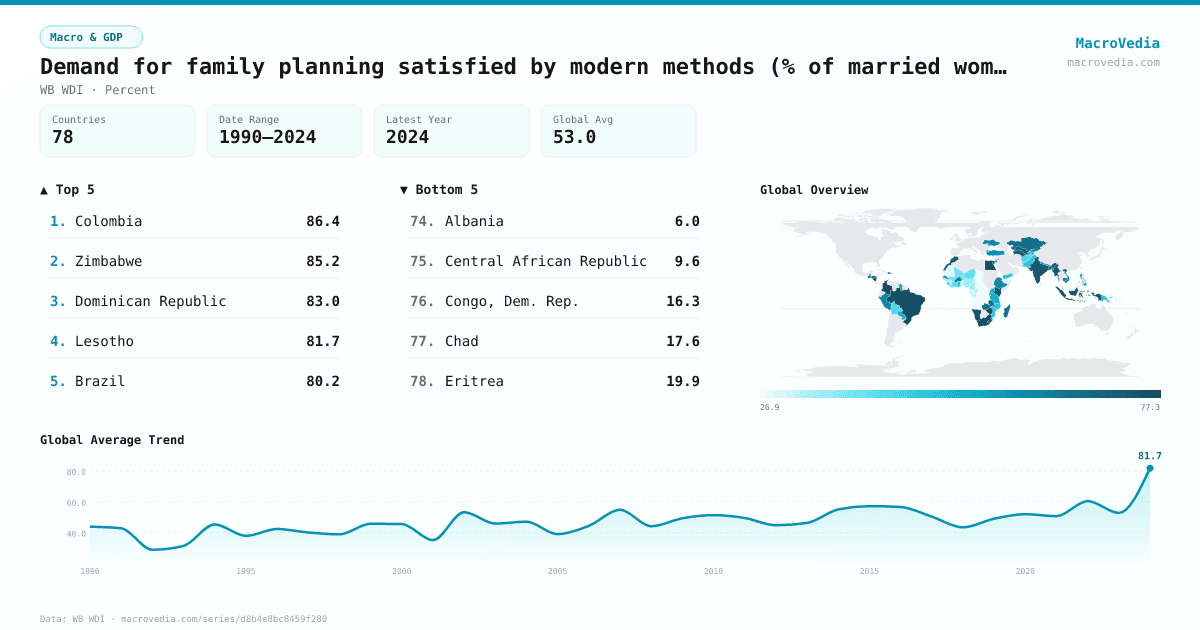
Demand for family planning satisfied by modern methods (% of married women with demand for family planning)
Macro & GDPWB WDIwb_wdi:SH.FPL.SATM.ZS•Percent•1990 → 2024•78 countries
Series quick facts
High-level context for this country series.
Macro & GDPWB WDI
Coverage
78
Frequency
yearly
Range
1990 \u2192 2024
Latest
2024
Demand for family planning satisfied by modern methods (% of married women with demand for family planning) by country
Latest available value per country (as of 2024)
Low \u2192 High
Unit: %
≤ 31.4%
31.4% – 40.9%
40.9% – 48.6%
48.6% – 59.1%
59.1% – 66.6%
66.6% – 75%
> 75%
No data
Generated by MacroVedia.comSource: World Bank (WB WDI)
Highest 15 countries
Demand for family planning satisfied by modern methods (% of married women with demand for family planning)
78 countries with data
Generated by MacroVedia.comSource: World Bank (WB WDI)
Distribution across countries
Demand for family planning satisfied by modern methods (% of married women with demand for family planning)
Countries
78
Median
53.8%
Mean
53.2%
25th pctl
39.9%
75th pctl
70.9%
Generated by MacroVedia.comSource: World Bank (WB WDI)
Compare trends
Demand for family planning satisfied by modern methods (% of married women with demand for family planning)
SenegalBangladeshPeru
Generated by MacroVedia.comSource: World Bank (WB WDI)
| Country | Latest | Date | Trend |
|---|---|---|---|
| ColombiaCOL | 86.4% | 2015 | |
| ZimbabweZWE | 85.2% | 2015 | |
| Dominican RepublicDOM | 83% | 2013 | |
| LesothoLSO | 81.7% | 2024 | |
| BrazilBRA | 80.2% | 1996 | — |
| Egypt, Arab Rep.EGY | 80% | 2014 | |
| NicaraguaNIC | 79.4% | 2001 | |
| South AfricaZAF | 77.8% | 2016 | |
| IndonesiaIDN | 77.1% | 2017 | |
| HondurasHND | 76.1% | 2012 | |
| RwandaRWA | 75.2% | 2020 | |
| NamibiaNAM | 75% | 2013 | |
| MyanmarMMR | 74.9% | 2016 | — |
| KenyaKEN | 74.7% | 2022 | |
| MalawiMWI | 74.6% | 2016 | |
| IndiaIND | 74.1% | 2021 | |
| UzbekistanUZB | 74.1% | 1996 | — |
| BangladeshBGD | 73.9% | 2022 | |
| MoroccoMAR | 73.2% | 2004 | |
| TurkmenistanTKM | 70.9% | 2000 | — |
| ZambiaZMB | 68.5% | 2018 | |
| KazakhstanKAZ | 67.7% | 1999 | |
| Viet NamVNM | 66.6% | 2002 | |
| MadagascarMDG | 66.4% | 2021 | |
| GuatemalaGTM | 65.6% | 2015 | |
| Burkina FasoBFA | 63.9% | 2021 | |
| EswatiniSWZ | 63.3% | 2007 | — |
| Kyrgyz RepublicKGZ | 62% | 2012 | |
| UkraineUKR | 61.9% | 2007 | — |
| PeruPER | 61.1% | 2012 | |
| CambodiaKHM | 60.8% | 2022 | |
| EthiopiaETH | 60.6% | 2016 | |
| TurkiyeTUR | 59.8% | 2013 | |
| PhilippinesPHL | 59.1% | 2022 | |
| GuyanaGUY | 56.3% | 2009 | — |
| SenegalSEN | 56.1% | 2023 | |
| MoldovaMDA | 55.4% | 2005 | — |
| NepalNPL | 54.7% | 2022 | |
| JordanJOR | 54.1% | 2023 | |
| ParaguayPRY | 53.5% | 1990 | — |
| TanzaniaTZA | 53.1% | 2022 | |
| TajikistanTJK | 52.1% | 2017 | |
| UgandaUGA | 51.6% | 2016 | |
| Papua New GuineaPNG | 48.7% | 2018 | — |
| PakistanPAK | 48.6% | 2018 | |
| MozambiqueMOZ | 48% | 2023 | |
| Timor-LesteTLS | 46.9% | 2016 | |
| Yemen, Rep.YEM | 46.9% | 2013 | |
| GhanaGHA | 46.5% | 2022 | |
| Sierra LeoneSLE | 45.4% | 2019 | |
| Sao Tome and PrincipeSTP | 44.3% | 2009 | — |
| HaitiHTI | 44% | 2017 | |
| BoliviaBOL | 42.8% | 2008 | |
| AfghanistanAFG | 42.2% | 2015 | — |
| Cote d'IvoireCIV | 41.4% | 2021 | |
| LiberiaLBR | 40.9% | 2020 | |
| NigerNER | 40.8% | 2012 | |
| ArmeniaARM | 40.2% | 2016 | |
| MaliMLI | 39.9% | 2018 | |
| Gambia, TheGMB | 39.6% | 2020 | |
| BurundiBDI | 39.4% | 2017 | |
| CameroonCMR | 36.4% | 2018 | |
| NigeriaNGA | 33.9% | 2018 | |
| TogoTGO | 32.3% | 2014 | |
| GuineaGIN | 32.1% | 2018 | |
| Congo, Rep.COG | 31.7% | 2012 | |
| ChadTCD | 31.4% | 2004 | |
| MaldivesMDV | 29.8% | 2017 | |
| GabonGAB | 29.7% | 2021 | |
| MauritaniaMRT | 28.2% | 2021 | |
| ComorosCOM | 27.4% | 2012 | |
| BeninBEN | 25.9% | 2018 | |
| AngolaAGO | 24.3% | 2016 | — |
| AzerbaijanAZE | 21.5% | 2006 | — |
| EritreaERI | 19.9% | 2002 | |
| Congo, Dem. Rep.COD | 16.3% | 2014 | |
| AlbaniaALB | 12.9% | 2009 | — |
| Central African RepublicCAF | 9.6% | 1995 | — |
Source: World Bank (WB WDI)