Annual freshwater withdrawals, domestic (% of total freshwater withdrawal)
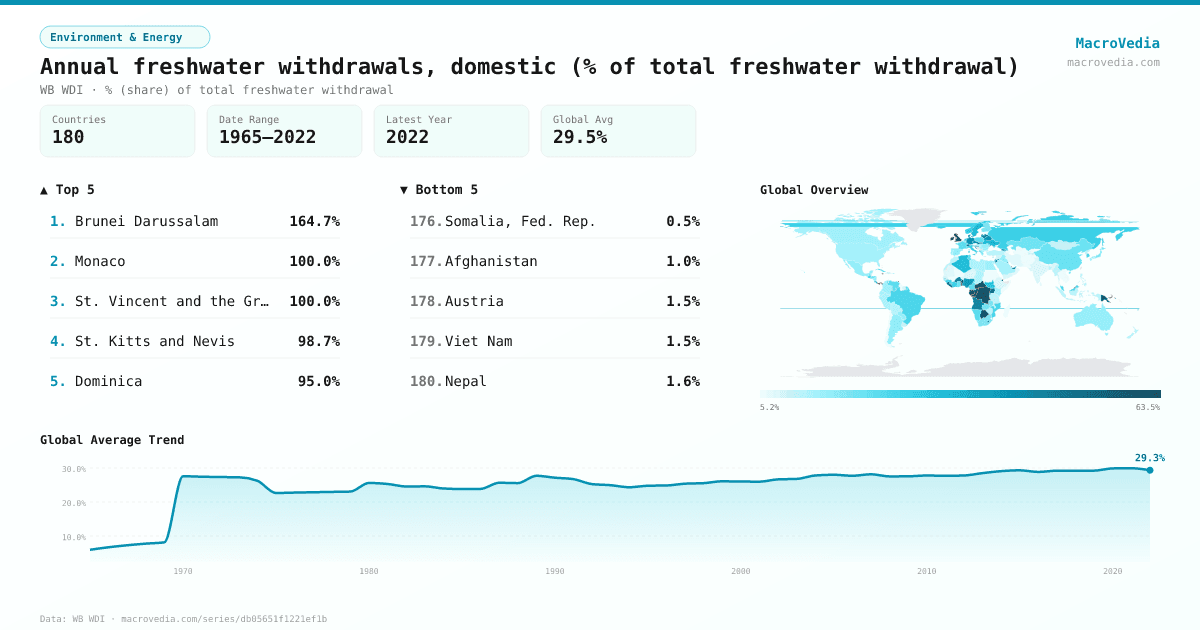
Environment & EnergyWB WDIwb_wdi:ER.H2O.FWDM.ZS•% (share) of total freshwater withdrawal•1965 → 2022•180 countries
Series quick facts
High-level context for this country series.
Environment & EnergyWB WDI
Coverage
180
Frequency
yearly
Range
1965 \u2192 2022
Latest
2022
Annual freshwater withdrawals, domestic (% of total freshwater withdrawal) by country
Latest available value per country (as of 2022)
Low \u2192 High
Unit: %
≤ 6.95%
6.95% – 11.82%
11.82% – 15.83%
15.83% – 25.16%
25.16% – 40.91%
40.91% – 61.35%
> 61.35%
No data
Generated by MacroVedia.comSource: World Bank (WB WDI)
Highest 15 countries
Annual freshwater withdrawals, domestic (% of total freshwater withdrawal)
50 countries with data
Generated by MacroVedia.comSource: World Bank (WB WDI)
Distribution across countries
Annual freshwater withdrawals, domestic (% of total freshwater withdrawal)
Countries
50
Median
62%
Mean
65.7%
25th pctl
51.5%
75th pctl
73.4%
Generated by MacroVedia.comSource: World Bank (WB WDI)
Compare trends
Annual freshwater withdrawals, domestic (% of total freshwater withdrawal)
UgandaMauritiusQatar
Generated by MacroVedia.comSource: World Bank (WB WDI)
| Country | Latest | Date | Trend |
|---|---|---|---|
| Brunei DarussalamBRN | 164.67% | 2022 | |
| MonacoMCO | 100% | 2022 | |
| St. Vincent and the GrenadinesVCT | 99.98% | 2022 | |
| St. Kitts and NevisKNA | 98.72% | 2022 | |
| DominicaDMA | 95% | 2022 | |
| MaldivesMDV | 94.92% | 2022 | |
| LuxembourgLUX | 91.18% | 2022 | |
| GrenadaGRD | 85.11% | 2022 | |
| DjiboutiDJI | 84.21% | 2022 | |
| Central African RepublicCAF | 82.9% | 2022 | |
| Equatorial GuineaGNQ | 79.8% | 2022 | |
| United KingdomGBR | 73.95% | 2022 | |
| JamaicaJAM | 73.43% | 2022 | |
| BoliviaBOL | 70.24% | 2021 | |
| Congo, Rep.COG | 69.47% | 2022 | |
| Congo, Dem. Rep.COD | 68.01% | 2022 | |
| IrelandIRL | 66.1% | 2022 | |
| SeychellesSYC | 65.69% | 2022 | |
| MaltaMLT | 63.85% | 2022 | |
| BahrainBHR | 63.44% | 2022 | |
| TogoTGO | 63.09% | 2022 | |
| PanamaPAN | 62.66% | 2022 | |
| Antigua and BarbudaATG | 62.61% | 2022 | |
| QatarQAT | 62.39% | 2022 | |
| Trinidad and TobagoTTO | 62% | 2022 | |
| BeninBEN | 61.97% | 2022 | |
| GabonGAB | 60.89% | 2022 | |
| BotswanaBWA | 60.64% | 2022 | |
| Cabo VerdeCPV | 58.89% | 2022 | |
| Papua New GuineaPNG | 57% | 2022 | |
| West Bank and GazaPSE | 56.43% | 2021 | |
| LiberiaLBR | 54.97% | 2022 | |
| SingaporeSGP | 54.93% | 2022 | |
| Slovak RepublicSVK | 54.33% | 2022 | |
| SwitzerlandCHE | 53.67% | 2022 | |
| LatviaLVA | 53.35% | 2022 | |
| Sierra LeoneSLE | 52.31% | 2022 | |
| UgandaUGA | 51.49% | 2022 | |
| MauritiusMUS | 50.55% | 2022 | |
| ComorosCOM | 48% | 2022 | |
| NamibiaNAM | 47.72% | 2021 | |
| United Arab EmiratesARE | 47.68% | 2022 | |
| Burkina FasoBFA | 45.92% | 2022 | |
| CroatiaHRV | 45.77% | 2022 | |
| LesothoLSO | 45.66% | 2022 | |
| LithuaniaLTU | 45.54% | 2022 | |
| AngolaAGO | 45.27% | 2022 | |
| JordanJOR | 45.02% | 2022 | |
| CzechiaCZE | 43.29% | 2022 | |
| BelarusBLR | 42.43% | 2022 |
Source: World Bank (WB WDI)