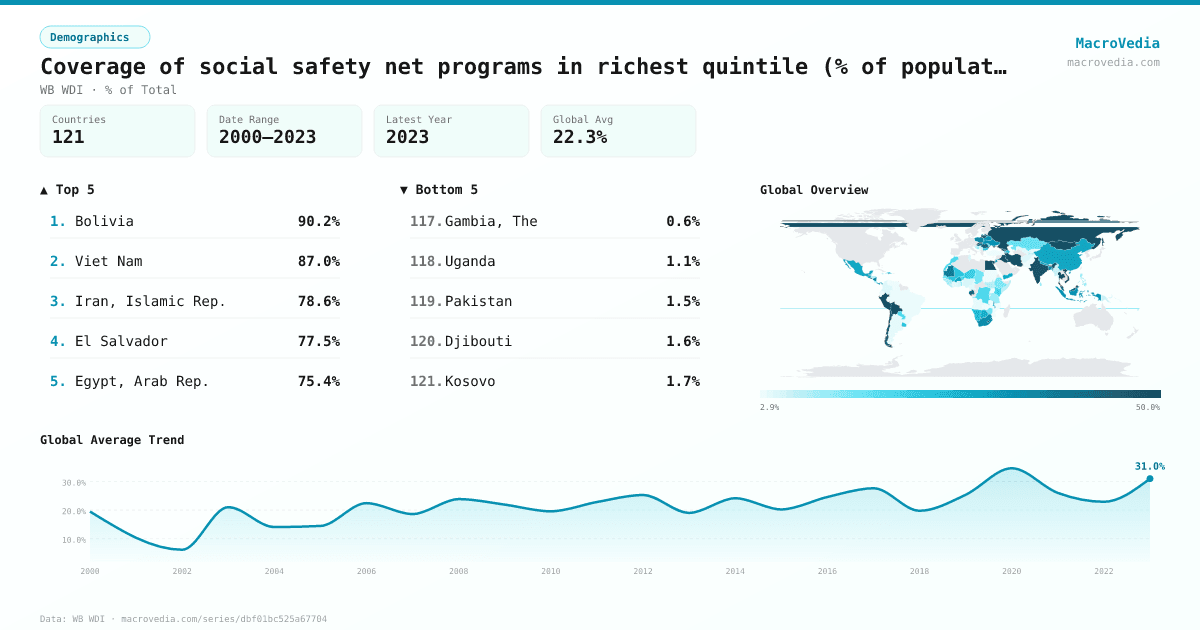
Coverage of social safety net programs in richest quintile (% of population)
DemographicsWB WDIwb_wdi:per_sa_allsa.cov_q5_tot•% of Total•2000 → 2023•121 countries
Series quick facts
High-level context for this country series.
DemographicsWB WDI
Coverage
121
Frequency
yearly
Range
2000 \u2192 2023
Latest
2023
Coverage of social safety net programs in richest quintile (% of population) by country
Latest available value per country (as of 2023)
Low \u2192 High
Unit: %
≤ 4.17%
4.17% – 7.25%
7.25% – 15.01%
15.01% – 22.34%
22.34% – 30.68%
30.68% – 45.64%
> 45.64%
No data
Generated by MacroVedia.comSource: World Bank (WB WDI)
Highest 15 countries
Coverage of social safety net programs in richest quintile (% of population)
50 countries with data
Generated by MacroVedia.comSource: World Bank (WB WDI)
Distribution across countries
Coverage of social safety net programs in richest quintile (% of population)
Countries
50
Median
37.2%
Mean
43.1%
25th pctl
28.7%
75th pctl
51.6%
Generated by MacroVedia.comSource: World Bank (WB WDI)
Compare trends
Coverage of social safety net programs in richest quintile (% of population)
PeruArmeniaBolivia
Generated by MacroVedia.comSource: World Bank (WB WDI)
| Country | Latest | Date | Trend |
|---|---|---|---|
| BoliviaBOL | 90.2% | 2021 | |
| Viet NamVNM | 86.98% | 2020 | |
| Iran, Islamic Rep.IRN | 78.65% | 2020 | |
| El SalvadorSLV | 77.53% | 2022 | |
| Egypt, Arab Rep.EGY | 75.35% | 2019 | |
| ThailandTHA | 71.15% | 2021 | |
| MongoliaMNG | 68.28% | 2020 | |
| JordanJOR | 62.04% | 2006 | — |
| IraqIRQ | 61.53% | 2012 | |
| GeorgiaGEO | 55.77% | 2021 | |
| Slovak RepublicSVK | 53.79% | 2009 | — |
| PeruPER | 51.82% | 2022 | |
| MauritiusMUS | 51.58% | 2017 | |
| Russian FederationRUS | 49.95% | 2017 | |
| IndiaIND | 48.16% | 2011 | |
| LithuaniaLTU | 47.16% | 2008 | — |
| LesothoLSO | 46.91% | 2017 | |
| ChileCHL | 45.77% | 2022 | |
| EswatiniSWZ | 44.84% | 2016 | |
| RomaniaROU | 43.38% | 2021 | |
| MalaysiaMYS | 43.25% | 2016 | |
| GabonGAB | 42.98% | 2017 | |
| HungaryHUN | 42.49% | 2007 | — |
| LatviaLVA | 39.97% | 2009 | |
| MauritaniaMRT | 37.28% | 2014 | |
| NicaraguaNIC | 37.13% | 2014 | |
| BangladeshBGD | 35.82% | 2022 | |
| UgandaUGA | 34.9% | 2012 | |
| PolandPOL | 34.82% | 2019 | |
| South AfricaZAF | 33.9% | 2021 | |
| BelarusBLR | 33.42% | 2019 | |
| IndonesiaIDN | 33.09% | 2022 | |
| UkraineUKR | 32.7% | 2020 | |
| JamaicaJAM | 31.46% | 2010 | |
| PanamaPAN | 31.02% | 2023 | |
| Timor-LesteTLS | 29.84% | 2011 | |
| ChinaCHN | 29.28% | 2013 | — |
| NepalNPL | 28.69% | 2010 | — |
| Burkina FasoBFA | 28.16% | 2021 | |
| GuatemalaGTM | 28.13% | 2014 | |
| MexicoMEX | 28.12% | 2022 | |
| Sierra LeoneSLE | 27.47% | 2011 | — |
| BotswanaBWA | 26.62% | 2015 | |
| Yemen, Rep.YEM | 26.33% | 2014 | |
| MalawiMWI | 26.02% | 2019 | |
| NamibiaNAM | 25.27% | 2015 | |
| UruguayURY | 24.72% | 2022 | |
| Dominican RepublicDOM | 24.55% | 2021 | |
| AzerbaijanAZE | 24.47% | 2015 | — |
| ArmeniaARM | 24.41% | 2022 |
Source: World Bank (WB WDI)