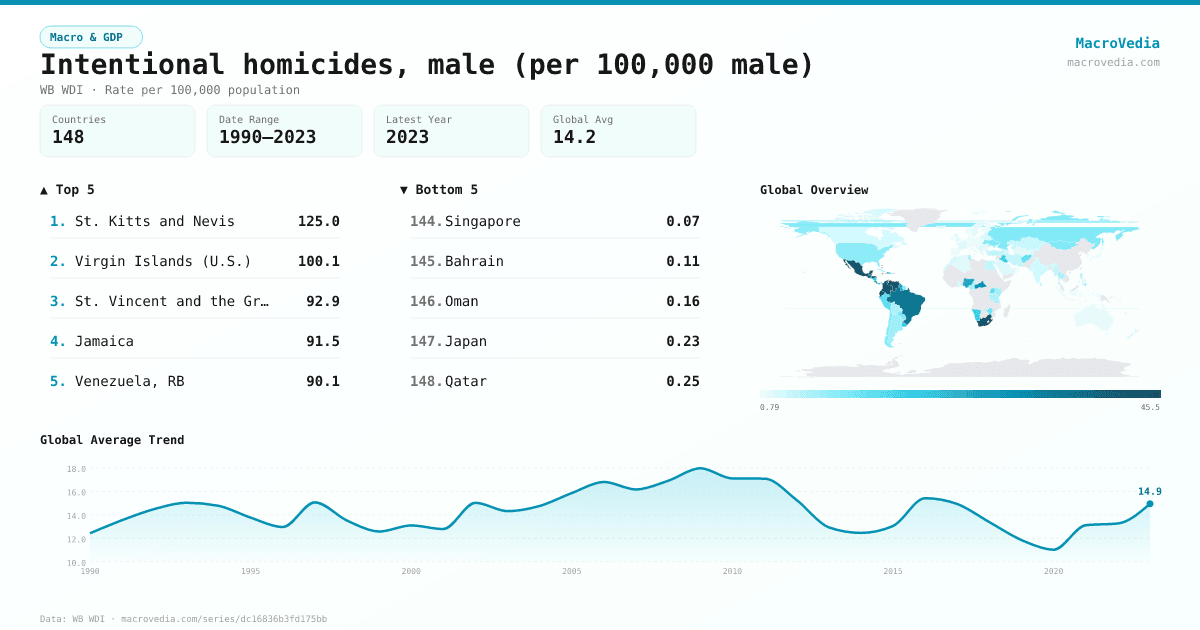
Intentional homicides, male (per 100,000 male)
Macro & GDPWB WDIwb_wdi:VC.IHR.PSRC.MA.P5•Rate per 100,000 population•1990 → 2023•148 countries
Series quick facts
High-level context for this country series.
Macro & GDPWB WDI
Coverage
148
Frequency
yearly
Range
1990 \u2192 2023
Latest
2023
Spotlight
St. Kitts and Nevis
KNA
124.9554 Rate per 100,000 population
2023
Virgin Islands (U.S.)
VIR
100.1232 Rate per 100,000 population
2012
St. Vincent and the Grenadines
VCT
92.9071 Rate per 100,000 population
2023
Jamaica
JAM
91.5471 Rate per 100,000 population
2023
Venezuela, RB
VEN
90.0658 Rate per 100,000 population
2017
Ecuador
ECU
84.5069 Rate per 100,000 population
2023
Intentional homicides, male (per 100,000 male) by country
Latest available value per country (as of 2023)
Low \u2192 High
Unit: Rate per 100,000 population
≤ 0.94
0.94 – 1.72
1.72 – 2.97
2.97 – 5.81
5.81 – 11.59
11.59 – 31.76
> 31.76
No data
Generated by MacroVedia.comSource: World Bank (WB WDI)
Highest 15 countries
Intentional homicides, male (per 100,000 male)
50 countries with data
Generated by MacroVedia.comSource: World Bank (WB WDI)
Distribution across countries
Intentional homicides, male (per 100,000 male)
Countries
50
Median
28
Mean
37.9
25th pctl
16.5
75th pctl
47.1
Generated by MacroVedia.comSource: World Bank (WB WDI)
Compare trends
Intentional homicides, male (per 100,000 male)
ColombiaMexicoBrazil
Generated by MacroVedia.comSource: World Bank (WB WDI)
| Country | Latest | Date | Trend |
|---|---|---|---|
| St. Kitts and NevisKNA | 124.96 Rate per 100,000 population | 2023 | |
| Virgin Islands (U.S.)VIR | 100.12 Rate per 100,000 population | 2012 | |
| St. Vincent and the GrenadinesVCT | 92.91 Rate per 100,000 population | 2023 | |
| JamaicaJAM | 91.55 Rate per 100,000 population | 2023 | |
| Venezuela, RBVEN | 90.07 Rate per 100,000 population | 2017 | |
| EcuadorECU | 84.51 Rate per 100,000 population | 2023 | |
| HaitiHTI | 74.22 Rate per 100,000 population | 2023 | |
| South AfricaZAF | 73.37 Rate per 100,000 population | 2022 | |
| St. LuciaLCA | 68.85 Rate per 100,000 population | 2023 | |
| Bahamas, TheBHS | 62.03 Rate per 100,000 population | 2022 | |
| HondurasHND | 54.78 Rate per 100,000 population | 2023 | |
| BelizeBLZ | 51.25 Rate per 100,000 population | 2022 | |
| Trinidad and TobagoTTO | 47.12 Rate per 100,000 population | 2020 | |
| ColombiaCOL | 46.95 Rate per 100,000 population | 2023 | |
| American SamoaASM | 46.49 Rate per 100,000 population | 2018 | |
| DominicaDMA | 45.05 Rate per 100,000 population | 2023 | |
| MexicoMEX | 44.88 Rate per 100,000 population | 2023 | |
| GuatemalaGTM | 40.24 Rate per 100,000 population | 2023 | |
| BrazilBRA | 34.66 Rate per 100,000 population | 2023 | |
| Costa RicaCRI | 33.09 Rate per 100,000 population | 2023 | |
| CuracaoCUW | 32.62 Rate per 100,000 population | 2007 | |
| El SalvadorSLV | 31.76 Rate per 100,000 population | 2021 | |
| BarbadosBRB | 30.28 Rate per 100,000 population | 2022 | |
| Central African RepublicCAF | 29.79 Rate per 100,000 population | 2016 | — |
| BermudaBMU | 28.36 Rate per 100,000 population | 2022 | |
| Puerto Rico (US)PRI | 27.69 Rate per 100,000 population | 2023 | |
| GuyanaGUY | 27.08 Rate per 100,000 population | 2023 | |
| British Virgin IslandsVGB | 26.11 Rate per 100,000 population | 2004 | |
| GrenadaGRD | 25.53 Rate per 100,000 population | 2023 | |
| NigeriaNGA | 24.4 Rate per 100,000 population | 2023 | — |
| SeychellesSYC | 24.17 Rate per 100,000 population | 2014 | |
| PanamaPAN | 21.71 Rate per 100,000 population | 2023 | |
| Antigua and BarbudaATG | 20.27 Rate per 100,000 population | 2023 | |
| UruguayURY | 19.78 Rate per 100,000 population | 2023 | |
| NicaraguaNIC | 19.78 Rate per 100,000 population | 2021 | |
| Dominican RepublicDOM | 19.58 Rate per 100,000 population | 2023 | |
| Cayman IslandsCYM | 16.71 Rate per 100,000 population | 2014 | |
| NamibiaNAM | 16.48 Rate per 100,000 population | 2021 | |
| IraqIRQ | 15.89 Rate per 100,000 population | 2013 | |
| UgandaUGA | 15.04 Rate per 100,000 population | 2023 | |
| PeruPER | 13.13 Rate per 100,000 population | 2021 | |
| AfghanistanAFG | 12.16 Rate per 100,000 population | 2018 | |
| ZimbabweZWE | 11.59 Rate per 100,000 population | 2022 | |
| ParaguayPRY | 11.45 Rate per 100,000 population | 2023 | |
| SamoaWSM | 11.43 Rate per 100,000 population | 2018 | |
| ChileCHL | 11.36 Rate per 100,000 population | 2023 | |
| Turks and Caicos IslandsTCA | 11.31 Rate per 100,000 population | 2014 | |
| SurinameSUR | 10.82 Rate per 100,000 population | 2023 | |
| UkraineUKR | 10.82 Rate per 100,000 population | 2017 | |
| Cabo VerdeCPV | 10.31 Rate per 100,000 population | 2020 |
Source: World Bank (WB WDI)