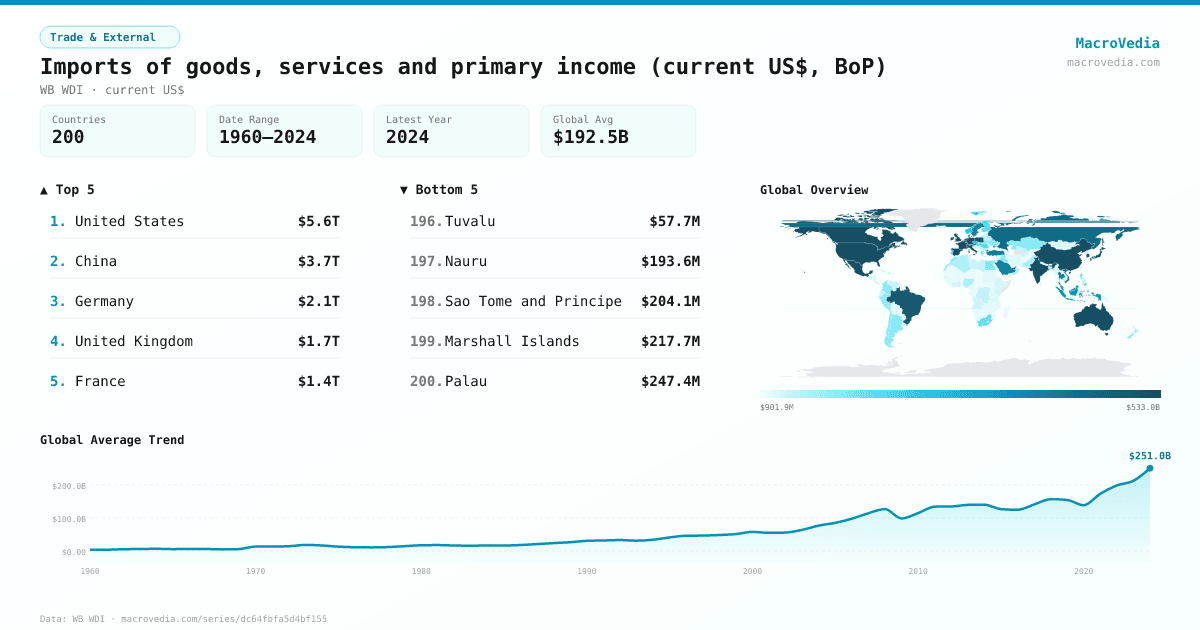
Imports of goods, services and primary income (current US$, BoP)
Trade & ExternalWB WDIwb_wdi:BM.GSR.TOTL.CD•current US$•1960 → 2024•200 countries
Series quick facts
High-level context for this country series.
Trade & ExternalWB WDI
Coverage
200
Frequency
yearly
Range
1960 \u2192 2024
Latest
2024
Imports of goods, services and primary income (current US$, BoP) by country
Latest available value per country (as of 2024)
Low \u2192 High
Unit: US$
≤ 1.66B
1.66B – 6.2B
6.2B – 12.99B
12.99B – 32.19B
32.19B – 75.9B
75.9B – 356.27B
> 356.27B
No data
Generated by MacroVedia.comSource: World Bank (WB WDI)
Highest 15 countries
Imports of goods, services and primary income (current US$, BoP)
50 countries with data
Generated by MacroVedia.comSource: World Bank (WB WDI)
Distribution across countries
Imports of goods, services and primary income (current US$, BoP)
Countries
50
Median
$406.22B
Mean
$710.18B
25th pctl
$174.32B
75th pctl
$870.06B
Generated by MacroVedia.comSource: World Bank (WB WDI)
Compare trends
Imports of goods, services and primary income (current US$, BoP)
CanadaSouth AfricaIsrael
Generated by MacroVedia.comSource: World Bank (WB WDI)
| Country | Latest | Date | Trend |
|---|---|---|---|
| United StatesUSA | $5.63T | 2024 | |
| ChinaCHN | $3.69T | 2024 | |
| GermanyDEU | $2.06T | 2024 | |
| United KingdomGBR | $1.71T | 2024 | |
| FranceFRA | $1.42T | 2024 | |
| NetherlandsNLD | $1.3T | 2024 | |
| JapanJPN | $1.13T | 2024 | |
| IrelandIRL | $1.08T | 2024 | |
| SingaporeSGP | $1.07T | 2024 | |
| IndiaIND | $1.03T | 2024 | |
| Hong Kong SAR, ChinaHKG | $967.01B | 2024 | |
| CanadaCAN | $916.85B | 2024 | |
| ItalyITA | $870.06B | 2024 | |
| SwitzerlandCHE | $827B | 2024 | |
| Korea, Rep.KOR | $803.43B | 2024 | |
| MexicoMEX | $784.93B | 2024 | |
| SpainESP | $708.78B | 2024 | |
| BelgiumBEL | $641.84B | 2024 | |
| LuxembourgLUX | $557.37B | 2024 | |
| United Arab EmiratesARE | $549.14B | 2024 | |
| AustraliaAUS | $531.22B | 2024 | |
| PolandPOL | $498.84B | 2024 | |
| BrazilBRA | $497.36B | 2024 | |
| Russian FederationRUS | $435.02B | 2024 | |
| Viet NamVNM | $419.91B | 2024 | |
| TurkiyeTUR | $392.53B | 2024 | |
| SwedenSWE | $383.4B | 2024 | |
| ThailandTHA | $381.35B | 2024 | |
| Saudi ArabiaSAU | $369.69B | 2024 | |
| AustriaAUT | $338.37B | 2024 | |
| IndonesiaIDN | $326.72B | 2024 | |
| MalaysiaMYS | $313.39B | 2024 | |
| DenmarkDNK | $295.22B | 2024 | |
| CzechiaCZE | $249.55B | 2024 | |
| NorwayNOR | $213.03B | 2024 | |
| HungaryHUN | $194.84B | 2024 | |
| RomaniaROU | $178.04B | 2024 | |
| PhilippinesPHL | $174.32B | 2024 | |
| IsraelISR | $162.6B | 2024 | |
| PortugalPRT | $162.06B | 2024 | |
| FinlandFIN | $157.39B | 2024 | |
| GreeceGRC | $141.09B | 2024 | |
| South AfricaZAF | $138.46B | 2024 | |
| Slovak RepublicSVK | $131.07B | 2024 | |
| ChileCHL | $128.35B | 2024 | |
| Egypt, Arab Rep.EGY | $118.75B | 2024 | |
| IraqIRQ | $107.81B | 2024 | |
| UkraineUKR | $104.33B | 2024 | |
| KazakhstanKAZ | $103.33B | 2024 | |
| ColombiaCOL | $101.06B | 2024 |
Source: World Bank (WB WDI)