Prevalence of underweight, weight for age, female (% of children under
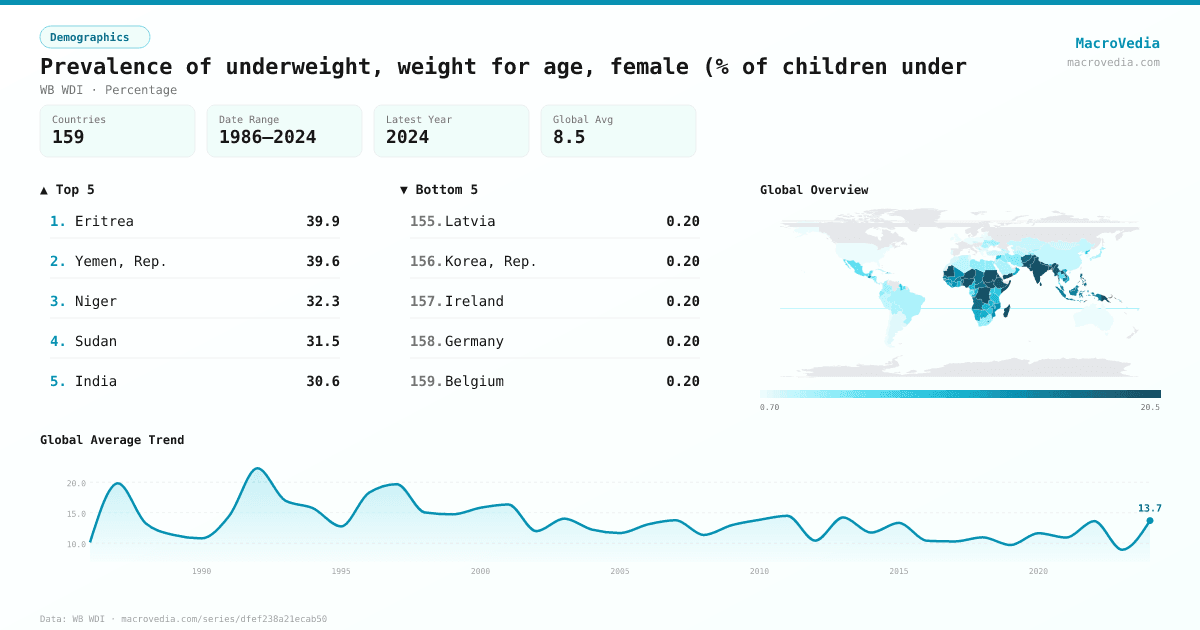
DemographicsWB WDIwb_wdi:SH.STA.MALN.FE.ZS•Percentage•1986 → 2024•159 countries
Series quick facts
High-level context for this country series.
DemographicsWB WDI
Coverage
159
Frequency
—
Range
1986 \u2192 2024
Latest
2024
Prevalence of underweight, weight for age, female (% of children under by country
Latest available value per country (as of 2024)
Low \u2192 High
Unit: %
≤ 1.6%
1.6% – 2.9%
2.9% – 4.24%
4.24% – 8.76%
8.76% – 11.49%
11.49% – 17.73%
> 17.73%
No data
Generated by MacroVedia.comSource: World Bank (WB WDI)
Highest 15 countries
Prevalence of underweight, weight for age, female (% of children under
50 countries with data
Generated by MacroVedia.comSource: World Bank (WB WDI)
Distribution across countries
Prevalence of underweight, weight for age, female (% of children under
Countries
50
Median
17.5%
Mean
19.4%
25th pctl
14.8%
75th pctl
22.9%
Generated by MacroVedia.comSource: World Bank (WB WDI)
Compare trends
Prevalence of underweight, weight for age, female (% of children under
NigerIndonesiaMali
Generated by MacroVedia.comSource: World Bank (WB WDI)
| Country | Latest | Date | Trend |
|---|---|---|---|
| EritreaERI | 39.9% | 2010 | |
| Yemen, Rep.YEM | 39.6% | 2022 | |
| NigerNER | 32.3% | 2022 | |
| SudanSDN | 31.5% | 2014 | |
| IndiaIND | 30.6% | 2020 | |
| Timor-LesteTLS | 30.2% | 2020 | |
| Papua New GuineaPNG | 26.6% | 2010 | |
| BurundiBDI | 25.6% | 2024 | |
| CambodiaKHM | 25% | 2014 | |
| South SudanSSD | 24.5% | 2010 | |
| NigeriaNGA | 23.7% | 2021 | |
| Lao PDRLAO | 23.4% | 2023 | |
| Congo, Dem. Rep.COD | 22.9% | 2023 | |
| PakistanPAK | 22.1% | 2018 | |
| BangladeshBGD | 21.8% | 2022 | |
| MadagascarMDG | 20.8% | 2021 | |
| Somalia, Fed. Rep.SOM | 20.7% | 2009 | |
| Sri LankaLKA | 20.4% | 2016 | |
| NepalNPL | 20.4% | 2022 | |
| MauritaniaMRT | 19.8% | 2022 | |
| EthiopiaETH | 19.4% | 2019 | |
| MyanmarMMR | 19.2% | 2018 | |
| PhilippinesPHL | 17.9% | 2021 | |
| AfghanistanAFG | 17.6% | 2022 | |
| BeninBEN | 17.5% | 2021 | |
| Guinea-BissauGNB | 17.4% | 2019 | |
| AngolaAGO | 17.1% | 2015 | |
| DjiboutiDJI | 17.1% | 2023 | |
| ChadTCD | 16.7% | 2022 | |
| Central African RepublicCAF | 16.6% | 2022 | |
| ComorosCOM | 16.6% | 2012 | |
| Solomon IslandsSLB | 16.1% | 2015 | |
| MaldivesMDV | 15.4% | 2017 | |
| SenegalSEN | 15.3% | 2023 | |
| IndonesiaIDN | 15.2% | 2023 | |
| Korea, Dem. People's Rep.PRK | 15% | 2012 | |
| Burkina FasoBFA | 14.8% | 2021 | |
| MalaysiaMYS | 14.8% | 2022 | |
| TogoTGO | 14.3% | 2017 | |
| MozambiqueMOZ | 13.5% | 2022 | |
| Cote d'IvoireCIV | 13.4% | 2021 | |
| GuineaGIN | 13.4% | 2022 | |
| MaliMLI | 13.3% | 2024 | |
| KiribatiKIR | 13% | 2009 | — |
| GuatemalaGTM | 12.8% | 2021 | |
| LesothoLSO | 11.5% | 2024 | |
| MalawiMWI | 11.4% | 2020 | |
| NamibiaNAM | 11.4% | 2013 | |
| OmanOMN | 11.4% | 2017 | |
| Sierra LeoneSLE | 11.4% | 2021 |
Source: World Bank (WB WDI)