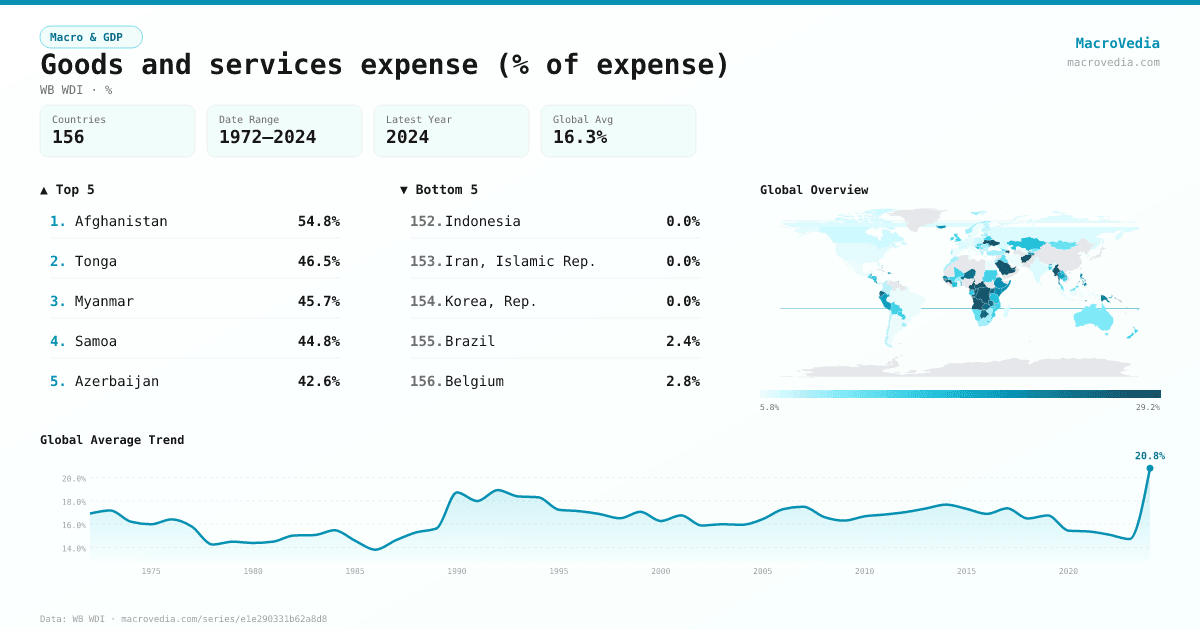
Goods and services expense (% of expense)
Macro & GDPWB WDIwb_wdi:GC.XPN.GSRV.ZS•%•1972 → 2024•156 countries
Series quick facts
High-level context for this country series.
Macro & GDPWB WDI
Coverage
156
Frequency
yearly
Range
1972 \u2192 2024
Latest
2024
Goods and services expense (% of expense) by country
Latest available value per country (as of 2024)
Low \u2192 High
Unit: %
≤ 6.57%
6.57% – 8.98%
8.98% – 13.19%
13.19% – 16.07%
16.07% – 20.86%
20.86% – 27.79%
> 27.79%
No data
Generated by MacroVedia.comSource: World Bank (WB WDI)
Highest 15 countries
Goods and services expense (% of expense)
50 countries with data
Generated by MacroVedia.comSource: World Bank (WB WDI)
Distribution across countries
Goods and services expense (% of expense)
Countries
50
Median
27.2%
Mean
28.3%
25th pctl
22.1%
75th pctl
30.8%
Generated by MacroVedia.comSource: World Bank (WB WDI)
Compare trends
Goods and services expense (% of expense)
SingaporeCosta RicaIceland
Generated by MacroVedia.comSource: World Bank (WB WDI)
| Country | Latest | Date | Trend |
|---|---|---|---|
| AfghanistanAFG | 54.78% | 2017 | |
| TongaTON | 46.54% | 2023 | |
| MyanmarMMR | 45.74% | 2019 | |
| SamoaWSM | 44.77% | 2023 | |
| AzerbaijanAZE | 42.55% | 2022 | |
| Solomon IslandsSLB | 38.5% | 2022 | |
| UkraineUKR | 35.7% | 2023 | |
| NauruNRU | 35.6% | 2020 | |
| CameroonCMR | 33.62% | 2021 | |
| Micronesia, Fed. Sts.FSM | 32.92% | 2020 | |
| Guinea-BissauGNB | 32.41% | 2023 | |
| Central African RepublicCAF | 31.7% | 2021 | |
| GuineaGIN | 30.79% | 1992 | |
| VanuatuVUT | 29.79% | 2023 | |
| KiribatiKIR | 29.38% | 2023 | |
| AngolaAGO | 29.36% | 2019 | |
| United Arab EmiratesARE | 28.94% | 2023 | |
| St. Kitts and NevisKNA | 28.32% | 2020 | |
| Gambia, TheGMB | 28.32% | 1990 | — |
| Timor-LesteTLS | 28.29% | 2022 | |
| SeychellesSYC | 27.91% | 2008 | |
| SingaporeSGP | 27.86% | 2023 | |
| RwandaRWA | 27.84% | 2023 | |
| Congo, Dem. Rep.COD | 27.48% | 2022 | |
| Saudi ArabiaSAU | 27.41% | 2023 | |
| Congo, Rep.COG | 27.07% | 2021 | |
| Marshall IslandsMHL | 25.88% | 2020 | |
| BotswanaBWA | 25.82% | 2024 | |
| UgandaUGA | 25.59% | 2023 | |
| Equatorial GuineaGNQ | 25.39% | 2022 | |
| ZambiaZMB | 25.36% | 2021 | |
| EcuadorECU | 24.59% | 2022 | |
| NigerNER | 24.12% | 1980 | |
| MaliMLI | 23.82% | 2019 | |
| Papua New GuineaPNG | 23.09% | 2023 | |
| San MarinoSMR | 22.87% | 2023 | |
| PhilippinesPHL | 22.34% | 2023 | |
| Trinidad and TobagoTTO | 22.07% | 2019 | |
| SenegalSEN | 21.89% | 2023 | |
| TajikistanTJK | 21.74% | 2023 | |
| Bahamas, TheBHS | 21.62% | 2023 | |
| IcelandISL | 21.48% | 2023 | |
| KenyaKEN | 21.35% | 2023 | |
| BelizeBLZ | 21.21% | 2017 | |
| EthiopiaETH | 20.91% | 2023 | |
| Costa RicaCRI | 20.76% | 2023 | |
| Cabo VerdeCPV | 20.46% | 2020 | |
| Somalia, Fed. Rep.SOM | 19.88% | 2023 | |
| PeruPER | 19.59% | 2021 | |
| St. LuciaLCA | 19.51% | 2017 |
Source: World Bank (WB WDI)