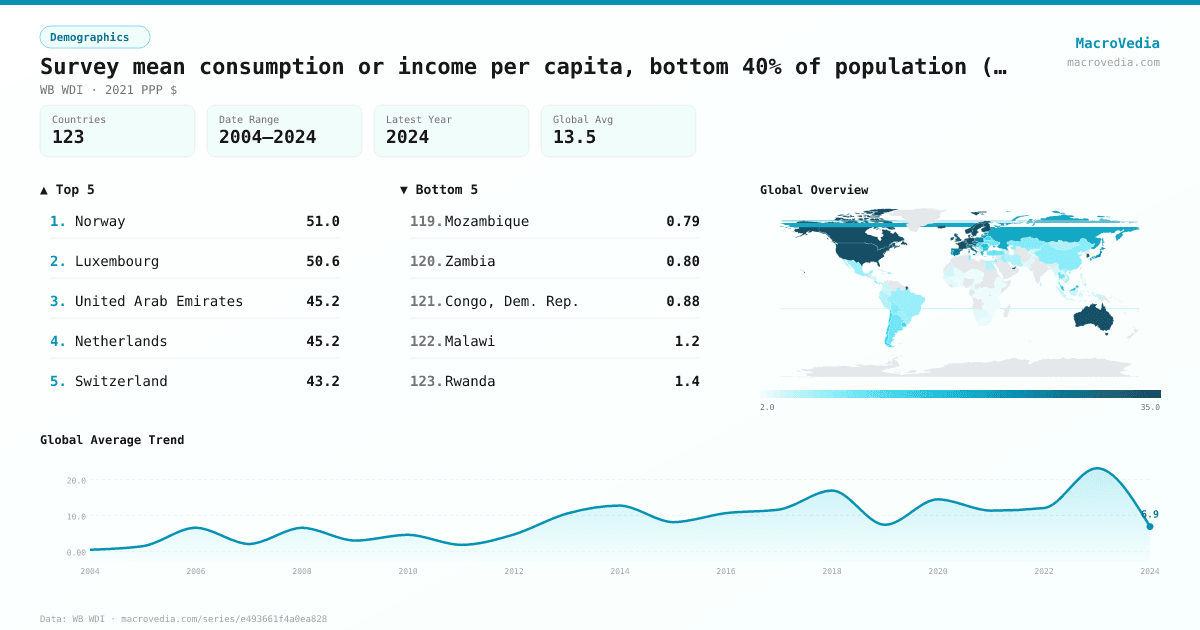
Survey mean consumption or income per capita, bottom 40% of population (2021 PPP $ per day)
DemographicsWB WDIwb_wdi:SI.SPR.PC40•2021 PPP $•2004 → 2024•123 countries
Series quick facts
High-level context for this country series.
DemographicsWB WDI
Coverage
123
Frequency
—
Range
2004 \u2192 2024
Latest
2024
Survey mean consumption or income per capita, bottom 40% of population (2021 PPP $ per day) by country
Latest available value per country (as of 2024)
Low \u2192 High
Unit: %
≤ 2.18%
2.18% – 3.67%
3.67% – 6.08%
6.08% – 8.77%
8.77% – 16.98%
16.98% – 33.56%
> 33.56%
No data
Generated by MacroVedia.comSource: World Bank (WB WDI)
Highest 15 countries
Survey mean consumption or income per capita, bottom 40% of population (2021 PPP $ per day)
50 countries with data
Generated by MacroVedia.comSource: World Bank (WB WDI)
Distribution across countries
Survey mean consumption or income per capita, bottom 40% of population (2021 PPP $ per day)
Countries
50
Median
25.5%
Mean
26.7%
25th pctl
15.9%
75th pctl
35.2%
Generated by MacroVedia.comSource: World Bank (WB WDI)
Compare trends
Survey mean consumption or income per capita, bottom 40% of population (2021 PPP $ per day)
NorwayLuxembourgUnited Arab Emirates
Generated by MacroVedia.comSource: World Bank (WB WDI)
| Country | Latest | Date | Trend |
|---|---|---|---|
| NorwayNOR | 50.96% | 2023 | |
| LuxembourgLUX | 50.65% | 2023 | |
| United Arab EmiratesARE | 45.24% | 2018 | |
| NetherlandsNLD | 45.2% | 2021 | |
| SwitzerlandCHE | 43.17% | 2022 | |
| AustriaAUT | 42.78% | 2023 | |
| BelgiumBEL | 41.04% | 2023 | |
| DenmarkDNK | 41.02% | 2023 | |
| CanadaCAN | 40.8% | 2021 | |
| GermanyDEU | 40.63% | 2020 | |
| IcelandISL | 40.31% | 2019 | |
| FinlandFIN | 37.41% | 2023 | |
| United StatesUSA | 35.16% | 2023 | |
| FranceFRA | 34.41% | 2023 | |
| AustraliaAUS | 34.15% | 2018 | |
| SwedenSWE | 34.02% | 2023 | |
| CyprusCYP | 33.66% | 2023 | |
| SloveniaSVN | 33.64% | 2023 | |
| IrelandIRL | 33.46% | 2023 | |
| United KingdomGBR | 32.21% | 2021 | |
| MaltaMLT | 32.04% | 2022 | |
| Korea, Rep.KOR | 31.73% | 2021 | |
| ItalyITA | 27.13% | 2023 | |
| SpainESP | 26.21% | 2023 | |
| CzechiaCZE | 26.18% | 2023 | |
| PolandPOL | 24.73% | 2023 | |
| JapanJPN | 23.84% | 2020 | |
| EstoniaEST | 23.22% | 2023 | |
| CroatiaHRV | 21.91% | 2023 | |
| LithuaniaLTU | 21.43% | 2023 | |
| PortugalPRT | 20.44% | 2023 | |
| Russian FederationRUS | 20.34% | 2023 | |
| LatviaLVA | 19.56% | 2023 | |
| IsraelISR | 17.55% | 2021 | |
| BulgariaBGR | 17.01% | 2023 | |
| RomaniaROU | 16.98% | 2023 | |
| GreeceGRC | 16.92% | 2023 | |
| MalaysiaMYS | 15.94% | 2021 | |
| Slovak RepublicSVK | 15.48% | 2023 | |
| UruguayURY | 14.27% | 2019 | |
| HungaryHUN | 13.1% | 2017 | |
| ChileCHL | 12.93% | 2022 | |
| BelarusBLR | 12.75% | 2020 | |
| SeychellesSYC | 11.79% | 2018 | |
| SerbiaSRB | 10.78% | 2022 | |
| TurkiyeTUR | 10.77% | 2022 | |
| Costa RicaCRI | 10.3% | 2024 | |
| ThailandTHA | 10.09% | 2023 | |
| ArgentinaARG | 9.6% | 2024 | |
| Dominican RepublicDOM | 9.56% | 2024 |
Source: World Bank (WB WDI)