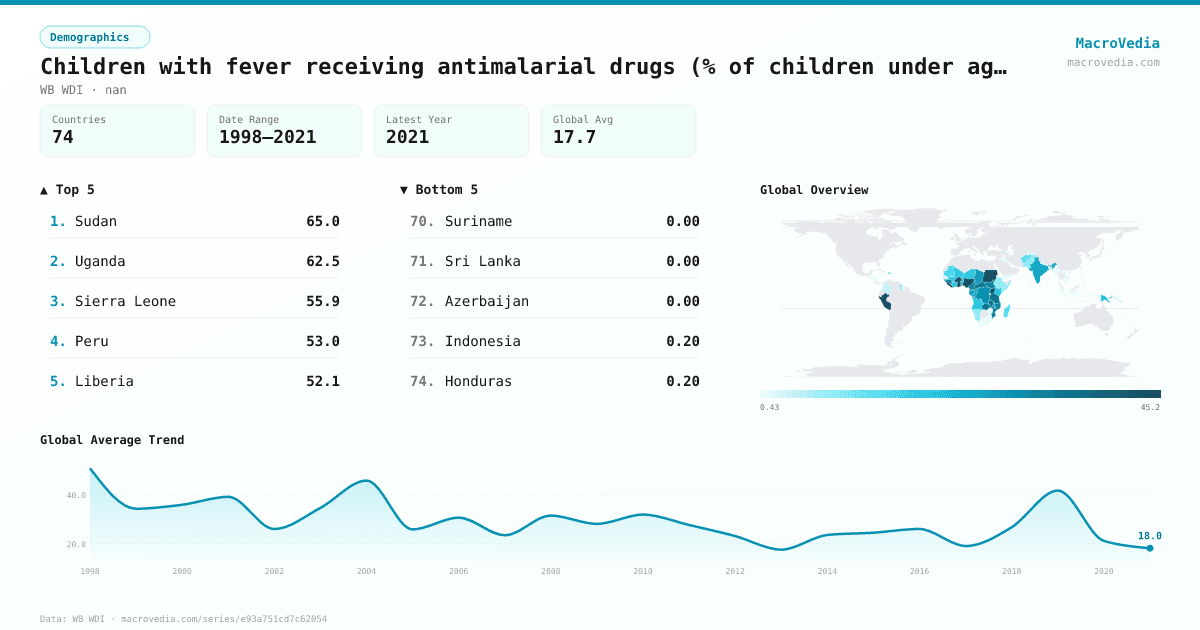
Children with fever receiving antimalarial drugs (% of children under age 5 with fever)
DemographicsWB WDIwb_wdi:SH.MLR.TRET.ZS•nan•1998 → 2021•74 countries
Series quick facts
High-level context for this country series.
DemographicsWB WDI
Coverage
74
Frequency
—
Range
1998 \u2192 2021
Latest
2021
Children with fever receiving antimalarial drugs (% of children under age 5 with fever) by country
Latest available value per country (as of 2021)
Low \u2192 High
Unit: %
≤ 1.09%
1.09% – 6.46%
6.46% – 13.61%
13.61% – 20.27%
20.27% – 32.01%
32.01% – 47.57%
> 47.57%
No data
Generated by MacroVedia.comSource: World Bank (WB WDI)
Highest 15 countries
Children with fever receiving antimalarial drugs (% of children under age 5 with fever)
50 countries with data
Generated by MacroVedia.comSource: World Bank (WB WDI)
Distribution across countries
Children with fever receiving antimalarial drugs (% of children under age 5 with fever)
Countries
50
Median
29.3%
Mean
30.8%
25th pctl
18.1%
75th pctl
45.9%
Generated by MacroVedia.comSource: World Bank (WB WDI)
Compare trends
Children with fever receiving antimalarial drugs (% of children under age 5 with fever)
GhanaZambiaNigeria
Generated by MacroVedia.comSource: World Bank (WB WDI)
| Country | Latest | Date | Trend |
|---|---|---|---|
| SudanSDN | 65% | 2010 | |
| ComorosCOM | 63% | 2000 | — |
| UgandaUGA | 62.5% | 2019 | |
| Central African RepublicCAF | 57% | 2006 | |
| Sierra LeoneSLE | 55.9% | 2019 | |
| VanuatuVUT | 53.1% | 2007 | — |
| PeruPER | 53% | 2012 | |
| LiberiaLBR | 52.1% | 2020 | |
| Guinea-BissauGNB | 51.2% | 2010 | |
| Burkina FasoBFA | 51.1% | 2018 | |
| Congo, Rep.COG | 48% | 2005 | — |
| BurundiBDI | 47% | 2017 | |
| GhanaGHA | 45.9% | 2019 | |
| NigeriaNGA | 43.5% | 2018 | |
| TanzaniaTZA | 36.2% | 2017 | |
| Cote d'IvoireCIV | 36% | 2006 | |
| ZambiaZMB | 34.9% | 2018 | |
| Equatorial GuineaGNQ | 33.2% | 2011 | |
| NigerNER | 33% | 2006 | |
| CameroonCMR | 32.7% | 2018 | |
| MozambiqueMOZ | 32.7% | 2018 | |
| South SudanSSD | 31.9% | 2013 | |
| GuineaGIN | 31.4% | 2021 | |
| TogoTGO | 31.1% | 2017 | |
| MalawiMWI | 29.4% | 2017 | |
| Congo, Dem. Rep.COD | 29.2% | 2014 | |
| ChadTCD | 26.9% | 2015 | |
| GabonGAB | 25.9% | 2012 | — |
| IndiaIND | 25.2% | 2021 | |
| NepalNPL | 24.2% | 2011 | |
| Papua New GuineaPNG | 21.3% | 2018 | — |
| NamibiaNAM | 20.3% | 2009 | |
| KenyaKEN | 20.2% | 2020 | |
| RwandaRWA | 19.6% | 2017 | |
| Solomon IslandsSLB | 19% | 2007 | — |
| Somalia, Fed. Rep.SOM | 19% | 1999 | — |
| MaliMLI | 18.7% | 2018 | |
| AngolaAGO | 18.1% | 2016 | |
| BeninBEN | 17.5% | 2018 | |
| MadagascarMDG | 15.3% | 2021 | |
| MauritaniaMRT | 15.3% | 2021 | |
| Dominican RepublicDOM | 14.9% | 2013 | |
| EritreaERI | 13.1% | 2008 | |
| AfghanistanAFG | 11.8% | 2015 | — |
| DjiboutiDJI | 10% | 2006 | — |
| Timor-LesteTLS | 10% | 2016 | |
| ArmeniaARM | 9.3% | 2016 | — |
| PakistanPAK | 9.2% | 2018 | |
| Sao Tome and PrincipeSTP | 8.4% | 2009 | |
| Lao PDRLAO | 8% | 2006 |
Source: World Bank (WB WDI)