Wanted fertility rate (births per woman)
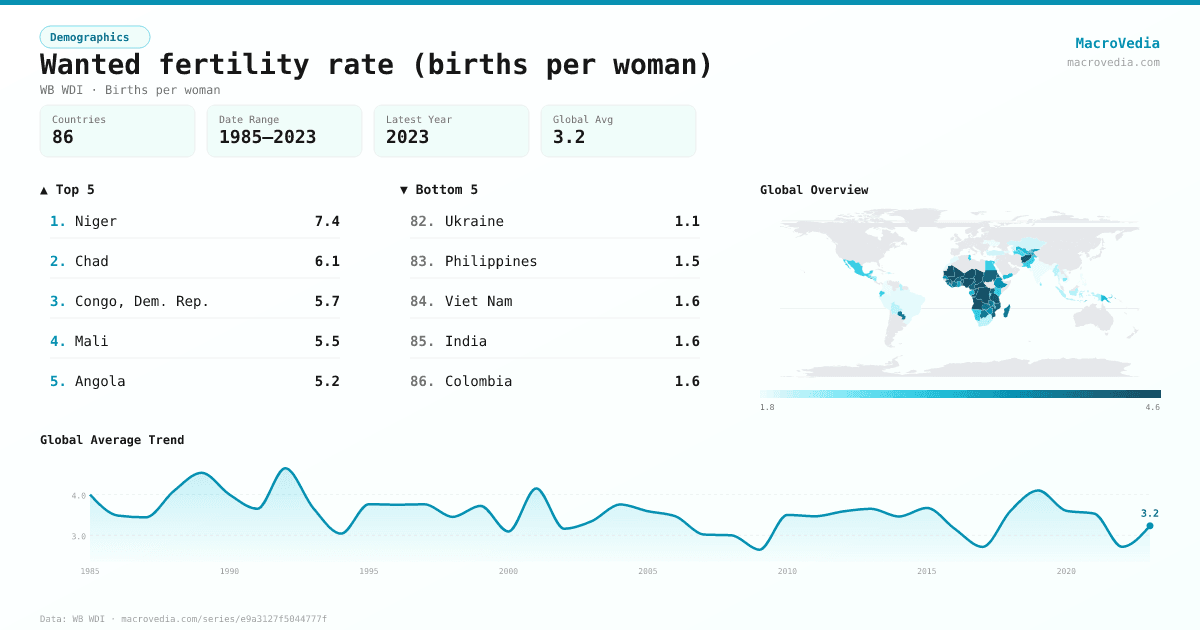
DemographicsWB WDIwb_wdi:SP.DYN.WFRT•Births per woman•1985 → 2023•86 countries
Series quick facts
High-level context for this country series.
DemographicsWB WDI
Coverage
86
Frequency
—
Range
1985 \u2192 2023
Latest
2023
Wanted fertility rate (births per woman) by country
Latest available value per country (as of 2023)
Low \u2192 High
Unit: Births per woman
≤ 1.8
1.8 – 2.1
2.1 – 2.84
2.84 – 3.4
3.4 – 3.9
3.9 – 4.39
> 4.39
No data
Generated by MacroVedia.comSource: World Bank (WB WDI)
Highest 15 countries
Wanted fertility rate (births per woman)
50 countries with data
Generated by MacroVedia.comSource: World Bank (WB WDI)
Distribution across countries
Wanted fertility rate (births per woman)
Countries
50
Median
3.9
Mean
4
25th pctl
3.4
75th pctl
4.4
Generated by MacroVedia.comSource: World Bank (WB WDI)
Compare trends
Wanted fertility rate (births per woman)
SenegalTanzaniaGhana
Generated by MacroVedia.comSource: World Bank (WB WDI)
| Country | Latest | Date | Trend |
|---|---|---|---|
| NigerNER | 7.4 Births per woman | 2012 | |
| ChadTCD | 6.1 Births per woman | 2015 | |
| Congo, Dem. Rep.COD | 5.7 Births per woman | 2014 | |
| MaliMLI | 5.5 Births per woman | 2018 | |
| AngolaAGO | 5.2 Births per woman | 2016 | — |
| BeninBEN | 4.9 Births per woman | 2018 | |
| Congo, Rep.COG | 4.8 Births per woman | 2012 | |
| NigeriaNGA | 4.8 Births per woman | 2018 | |
| Central African RepublicCAF | 4.7 Births per woman | 1995 | — |
| MauritaniaMRT | 4.5 Births per woman | 2021 | |
| AfghanistanAFG | 4.4 Births per woman | 2015 | — |
| EritreaERI | 4.4 Births per woman | 2002 | |
| TanzaniaTZA | 4.4 Births per woman | 2022 | |
| CameroonCMR | 4.3 Births per woman | 2018 | |
| GuineaGIN | 4.3 Births per woman | 2018 | |
| UgandaUGA | 4.3 Births per woman | 2016 | |
| Burkina FasoBFA | 4.2 Births per woman | 2021 | |
| MozambiqueMOZ | 4.2 Births per woman | 2023 | |
| SudanSDN | 4.2 Births per woman | 1990 | — |
| TogoTGO | 4.1 Births per woman | 2014 | |
| Gambia, TheGMB | 4 Births per woman | 2020 | |
| ParaguayPRY | 4 Births per woman | 1990 | — |
| El SalvadorSLV | 4 Births per woman | 1985 | — |
| ZambiaZMB | 4 Births per woman | 2018 | |
| BotswanaBWA | 3.9 Births per woman | 1988 | — |
| Cote d'IvoireCIV | 3.9 Births per woman | 2021 | |
| ComorosCOM | 3.8 Births per woman | 2012 | |
| MadagascarMDG | 3.8 Births per woman | 2021 | |
| Sierra LeoneSLE | 3.8 Births per woman | 2019 | |
| LiberiaLBR | 3.7 Births per woman | 2020 | |
| BurundiBDI | 3.6 Births per woman | 2017 | |
| EthiopiaETH | 3.6 Births per woman | 2016 | |
| SenegalSEN | 3.6 Births per woman | 2023 | |
| ZimbabweZWE | 3.6 Births per woman | 2015 | |
| TajikistanTJK | 3.5 Births per woman | 2017 | |
| Timor-LesteTLS | 3.5 Births per woman | 2016 | |
| GhanaGHA | 3.4 Births per woman | 2022 | |
| Kyrgyz RepublicKGZ | 3.4 Births per woman | 2012 | |
| MalawiMWI | 3.4 Births per woman | 2016 | |
| Sao Tome and PrincipeSTP | 3.3 Births per woman | 2009 | — |
| GabonGAB | 3.2 Births per woman | 2021 | |
| RwandaRWA | 3.1 Births per woman | 2020 | |
| UzbekistanUZB | 3.1 Births per woman | 1996 | — |
| Yemen, Rep.YEM | 3.1 Births per woman | 2013 | |
| Papua New GuineaPNG | 3 Births per woman | 2018 | — |
| KenyaKEN | 2.9 Births per woman | 2022 | |
| NamibiaNAM | 2.9 Births per woman | 2013 | |
| PakistanPAK | 2.9 Births per woman | 2018 | |
| TunisiaTUN | 2.9 Births per woman | 1988 | — |
| EcuadorECU | 2.8 Births per woman | 1987 | — |
Source: World Bank (WB WDI)