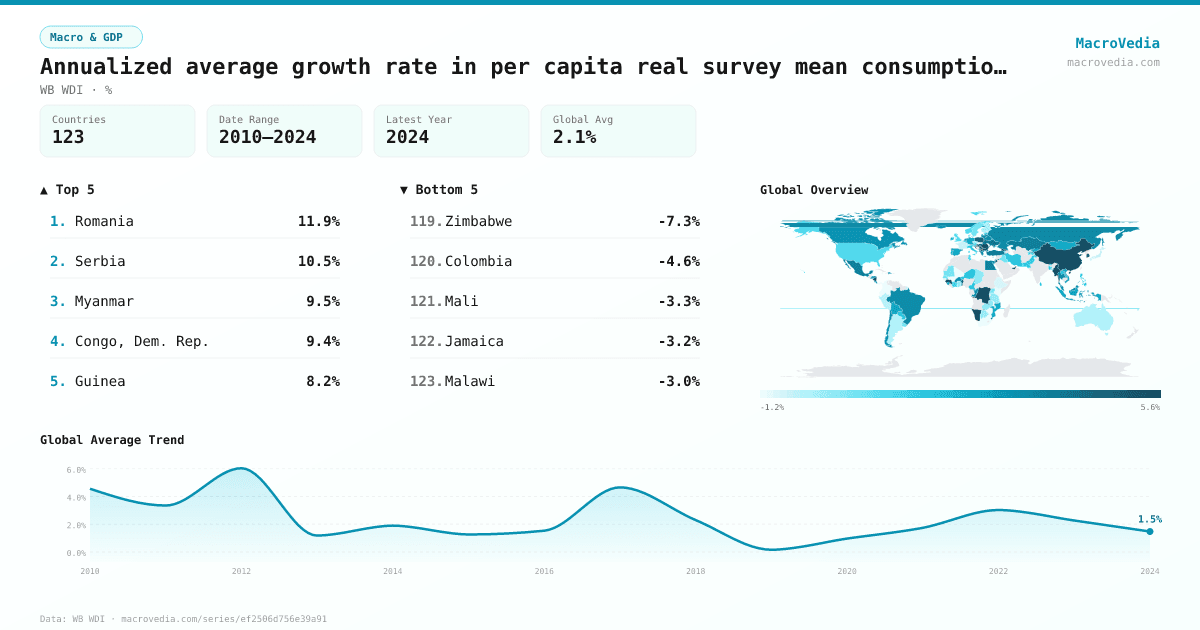
Annualized average growth rate in per capita real survey mean consumption or income, bottom 40% of population (%)
Macro & GDPWB WDIwb_wdi:SI.SPR.PC40.ZG•%•2010 → 2024•123 countries
Series quick facts
High-level context for this country series.
Macro & GDPWB WDI
Coverage
123
Frequency
—
Range
2010 \u2192 2024
Latest
2024
Annualized average growth rate in per capita real survey mean consumption or income, bottom 40% of population (%) by country
Latest available value per country (as of 2024)
Low \u2192 High
Unit: %
≤ -0.6%
-0.6% – 0.41%
0.41% – 1.56%
1.56% – 2.62%
2.62% – 3.32%
3.32% – 4.76%
> 4.76%
No data
Generated by MacroVedia.comSource: World Bank (WB WDI)
Highest 15 countries
Annualized average growth rate in per capita real survey mean consumption or income, bottom 40% of population (%)
50 countries with data
Generated by MacroVedia.comSource: World Bank (WB WDI)
Distribution across countries
Annualized average growth rate in per capita real survey mean consumption or income, bottom 40% of population (%)
Countries
50
Median
3.7%
Mean
4.7%
25th pctl
3.2%
75th pctl
5.6%
Generated by MacroVedia.comSource: World Bank (WB WDI)
Compare trends
Annualized average growth rate in per capita real survey mean consumption or income, bottom 40% of population (%)
RomaniaSerbiaMyanmar
Generated by MacroVedia.comSource: World Bank (WB WDI)
| Country | Latest | Date | Trend |
|---|---|---|---|
| RomaniaROU | 11.95% | 2023 | — |
| SerbiaSRB | 10.49% | 2022 | — |
| MyanmarMMR | 9.46% | 2017 | — |
| Congo, Dem. Rep.COD | 9.44% | 2012 | — |
| GuineaGIN | 8.22% | 2012 | — |
| ChinaCHN | 7.21% | 2021 | — |
| BulgariaBGR | 7.19% | 2023 | — |
| United Arab EmiratesARE | 7.08% | 2018 | — |
| CroatiaHRV | 6.37% | 2023 | — |
| GeorgiaGEO | 5.86% | 2024 | — |
| North MacedoniaMKD | 5.77% | 2019 | — |
| NamibiaNAM | 5.73% | 2015 | — |
| NicaraguaNIC | 5.64% | 2014 | — |
| KosovoXKX | 5.54% | 2022 | — |
| Korea, Rep.KOR | 5.11% | 2021 | — |
| PolandPOL | 4.89% | 2023 | — |
| BeninBEN | 4.84% | 2021 | — |
| HungaryHUN | 4.84% | 2017 | — |
| EswatiniSWZ | 4.66% | 2016 | — |
| JordanJOR | 4.56% | 2010 | — |
| UkraineUKR | 4.13% | 2020 | — |
| AlbaniaALB | 3.96% | 2020 | — |
| LuxembourgLUX | 3.84% | 2023 | — |
| TurkiyeTUR | 3.78% | 2022 | — |
| KazakhstanKAZ | 3.68% | 2021 | — |
| MontenegroMNE | 3.67% | 2021 | — |
| MexicoMEX | 3.64% | 2022 | — |
| Egypt, Arab Rep.EGY | 3.58% | 2021 | — |
| SeychellesSYC | 3.55% | 2018 | — |
| LithuaniaLTU | 3.53% | 2023 | — |
| LatviaLVA | 3.52% | 2023 | — |
| GreeceGRC | 3.51% | 2023 | — |
| ThailandTHA | 3.49% | 2023 | — |
| Russian FederationRUS | 3.41% | 2023 | — |
| Congo, Rep.COG | 3.35% | 2011 | — |
| BelarusBLR | 3.32% | 2020 | — |
| BrazilBRA | 3.28% | 2023 | — |
| MalaysiaMYS | 3.22% | 2021 | — |
| Burkina FasoBFA | 3.17% | 2021 | — |
| IcelandISL | 3.17% | 2019 | — |
| ChileCHL | 3.14% | 2022 | — |
| CanadaCAN | 3.05% | 2021 | — |
| Dominican RepublicDOM | 2.97% | 2024 | — |
| Costa RicaCRI | 2.89% | 2024 | — |
| NetherlandsNLD | 2.86% | 2021 | — |
| HondurasHND | 2.83% | 2024 | — |
| IndonesiaIDN | 2.72% | 2024 | — |
| MauritiusMUS | 2.71% | 2017 | — |
| Kyrgyz RepublicKGZ | 2.69% | 2023 | — |
| El SalvadorSLV | 2.69% | 2023 | — |
Source: World Bank (WB WDI)