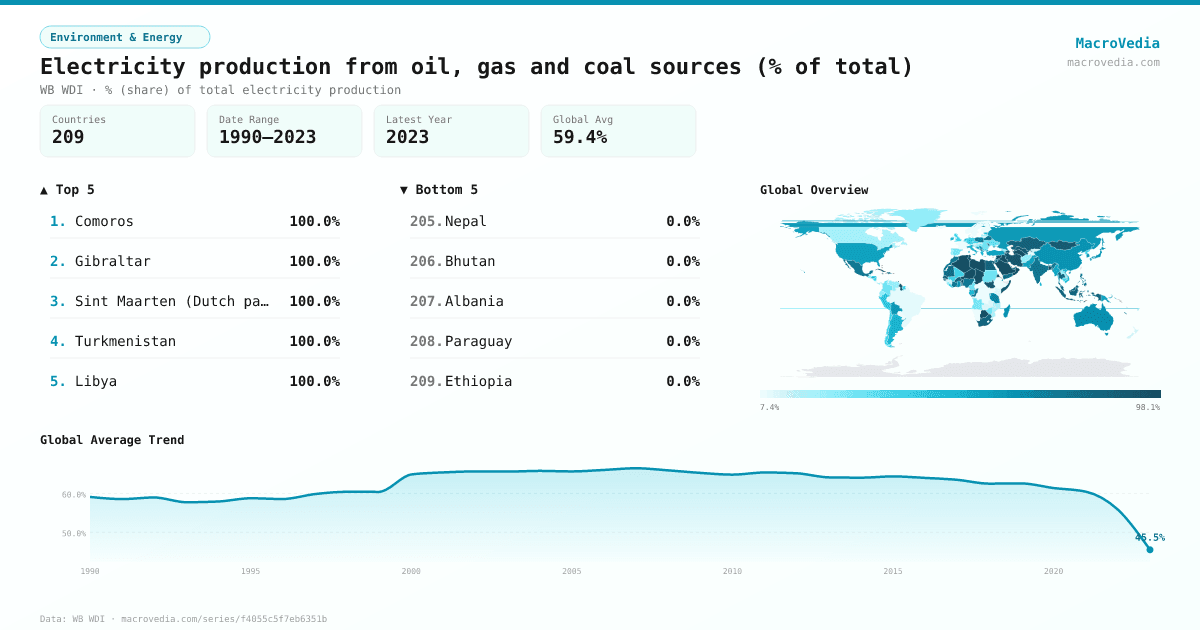
Electricity production from oil, gas and coal sources (% of total)
Environment & EnergyWB WDIwb_wdi:EG.ELC.FOSL.ZS•% (share) of total electricity production•1990 → 2023•209 countries
Series quick facts
High-level context for this country series.
Environment & EnergyWB WDI
Coverage
209
Frequency
yearly
Range
1990 \u2192 2023
Latest
2023
Electricity production from oil, gas and coal sources (% of total) by country
Latest available value per country (as of 2023)
Low \u2192 High
Unit: %
≤ 14.46%
14.46% – 34.89%
34.89% – 56.01%
56.01% – 77.38%
77.38% – 88.12%
88.12% – 96.88%
> 96.88%
No data
Generated by MacroVedia.comSource: World Bank (WB WDI)
Highest 15 countries
Electricity production from oil, gas and coal sources (% of total)
50 countries with data
Generated by MacroVedia.comSource: World Bank (WB WDI)
Distribution across countries
Electricity production from oil, gas and coal sources (% of total)
Countries
50
Median
97.5%
Mean
97.3%
25th pctl
95.5%
75th pctl
99.4%
Generated by MacroVedia.comSource: World Bank (WB WDI)
Compare trends
Electricity production from oil, gas and coal sources (% of total)
AlgeriaSingaporeGibraltar
Generated by MacroVedia.comSource: World Bank (WB WDI)
| Country | Latest | Date | Trend |
|---|---|---|---|
| ComorosCOM | 100% | 2021 | |
| GibraltarGIB | 100% | 2022 | |
| Sint Maarten (Dutch part)SXM | 100% | 2021 | |
| TurkmenistanTKM | 99.98% | 2022 | |
| LibyaLBY | 99.97% | 2022 | |
| Trinidad and TobagoTTO | 99.93% | 2022 | |
| Brunei DarussalamBRN | 99.88% | 2022 | |
| BahrainBHR | 99.86% | 2022 | |
| KuwaitKWT | 99.8% | 2022 | |
| BotswanaBWA | 99.76% | 2022 | |
| Timor-LesteTLS | 99.63% | 2021 | |
| Bahamas, TheBHS | 99.52% | 2021 | |
| Saudi ArabiaSAU | 99.4% | 2022 | |
| AlgeriaDZA | 99.24% | 2023 | |
| St. Martin (French part)MAF | 99.19% | 2021 | |
| Hong Kong SAR, ChinaHKG | 99.08% | 2022 | |
| QatarQAT | 98.91% | 2022 | |
| Turks and Caicos IslandsTCA | 98.52% | 2021 | |
| Gambia, TheGMB | 98.4% | 2021 | |
| BangladeshBGD | 98.38% | 2022 | |
| ChadTCD | 98.14% | 2022 | |
| GrenadaGRD | 98.03% | 2021 | |
| IraqIRQ | 97.97% | 2022 | |
| British Virgin IslandsVGB | 97.75% | 2021 | |
| Marshall IslandsMHL | 97.57% | 2021 | |
| Virgin Islands (U.S.)VIR | 97.5% | 2021 | |
| OmanOMN | 97.49% | 2022 | |
| St. LuciaLCA | 97.46% | 2021 | |
| EritreaERI | 97.24% | 2022 | |
| Cayman IslandsCYM | 97.06% | 2021 | |
| NigerNER | 96.8% | 2022 | |
| BeninBEN | 96.6% | 2022 | |
| American SamoaASM | 96.13% | 2021 | |
| TunisiaTUN | 95.93% | 2022 | |
| CubaCUB | 95.91% | 2022 | |
| Syrian Arab RepublicSYR | 95.73% | 2022 | |
| SeychellesSYC | 95.49% | 2021 | |
| St. Kitts and NevisKNA | 95.47% | 2021 | |
| Puerto Rico (US)PRI | 95.42% | 2021 | |
| PalauPLW | 95.4% | 2021 | |
| GuamGUM | 95.2% | 2021 | |
| Micronesia, Fed. Sts.FSM | 95.05% | 2021 | |
| SingaporeSGP | 95% | 2023 | |
| Antigua and BarbudaATG | 94.34% | 2021 | |
| MaldivesMDV | 94.18% | 2021 | |
| Sao Tome and PrincipeSTP | 93.94% | 2021 | |
| Iran, Islamic Rep.IRN | 93.94% | 2022 | |
| KosovoXKX | 93.63% | 2021 | |
| Solomon IslandsSLB | 93.44% | 2021 | |
| South SudanSSD | 93.31% | 2022 |
Source: World Bank (WB WDI)