Physicians (per 1,000 people)
Macro & GDPWB WDIwb_wdi:SH.MED.PHYS.ZS•Per 1000 people•1960 → 2023•208 countries
Series quick facts
High-level context for this country series.
Macro & GDPWB WDI
Coverage
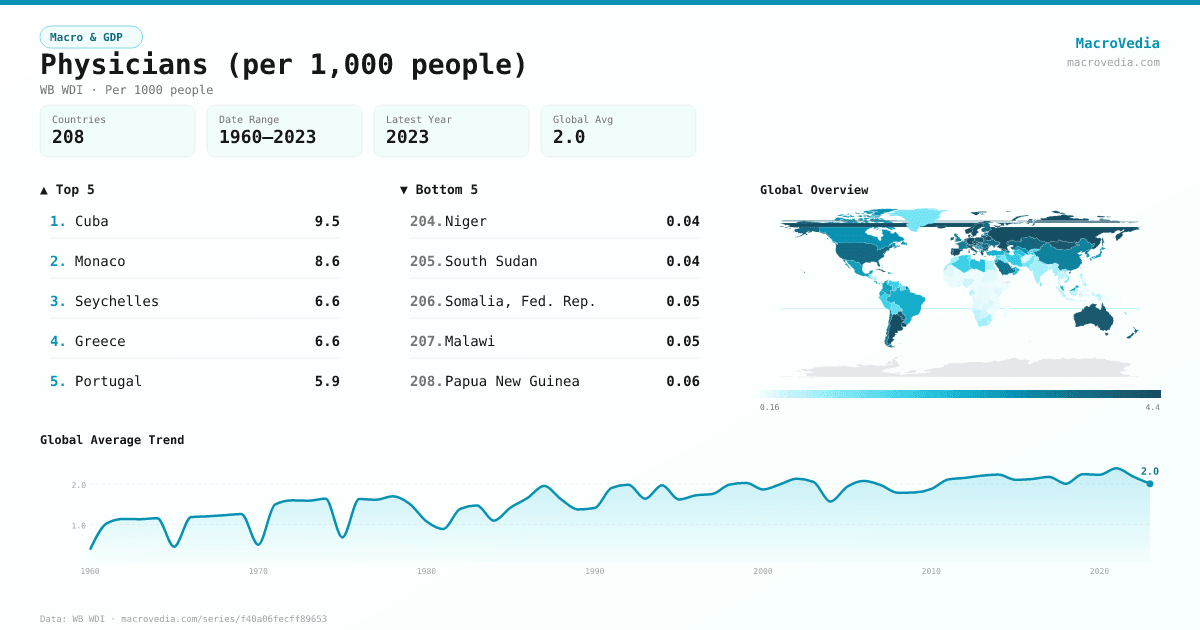
208
Frequency
yearly
Range
1960 \u2192 2023
Latest
2023
Physicians (per 1,000 people) by country
Latest available value per country (as of 2023)
Low \u2192 High
Unit: Per 1000 people
≤ 0.21
0.21 – 0.55
0.55 – 1.28
1.28 – 1.95
1.95 – 3.02
3.02 – 4.02
> 4.02
No data
Generated by MacroVedia.comSource: World Bank (WB WDI)
Highest 15 countries
Physicians (per 1,000 people)
50 countries with data
Generated by MacroVedia.comSource: World Bank (WB WDI)
Distribution across countries
Physicians (per 1,000 people)
Countries
50
Median
4.2
Mean
4.5
25th pctl
3.7
75th pctl
4.7
Generated by MacroVedia.comSource: World Bank (WB WDI)
Compare trends
Physicians (per 1,000 people)
IcelandSwitzerlandHungary
Generated by MacroVedia.comSource: World Bank (WB WDI)
| Country | Latest | Date | Trend |
|---|---|---|---|
| CubaCUB | 9.54 Per 1000 people | 2021 | |
| MonacoMCO | 8.61 Per 1000 people | 2020 | |
| SeychellesSYC | 6.6 Per 1000 people | 2022 | |
| GreeceGRC | 6.58 Per 1000 people | 2022 | |
| PortugalPRT | 5.85 Per 1000 people | 2022 | |
| GeorgiaGEO | 5.64 Per 1000 people | 2023 | |
| AustriaAUT | 5.52 Per 1000 people | 2023 | |
| Russian FederationRUS | 5.11 Per 1000 people | 2022 | |
| ArgentinaARG | 5.11 Per 1000 people | 2023 | |
| AndorraAND | 5.07 Per 1000 people | 2023 | |
| NorwayNOR | 4.98 Per 1000 people | 2023 | |
| BelarusBLR | 4.72 Per 1000 people | 2023 | |
| UruguayURY | 4.67 Per 1000 people | 2022 | |
| San MarinoSMR | 4.63 Per 1000 people | 2023 | |
| GermanyDEU | 4.53 Per 1000 people | 2022 | |
| MaltaMLT | 4.51 Per 1000 people | 2022 | |
| DenmarkDNK | 4.5 Per 1000 people | 2021 | |
| SwitzerlandCHE | 4.48 Per 1000 people | 2022 | |
| LithuaniaLTU | 4.47 Per 1000 people | 2022 | |
| SwedenSWE | 4.41 Per 1000 people | 2021 | |
| IcelandISL | 4.37 Per 1000 people | 2023 | |
| CzechiaCZE | 4.35 Per 1000 people | 2022 | |
| BulgariaBGR | 4.33 Per 1000 people | 2022 | |
| SpainESP | 4.29 Per 1000 people | 2022 | |
| St. LuciaLCA | 4.23 Per 1000 people | 2020 | |
| ItalyITA | 4.19 Per 1000 people | 2022 | |
| Trinidad and TobagoTTO | 4.16 Per 1000 people | 2021 | |
| MongoliaMNG | 4.13 Per 1000 people | 2022 | |
| AustraliaAUS | 4.09 Per 1000 people | 2022 | |
| PolandPOL | 4.03 Per 1000 people | 2023 | |
| MoldovaMDA | 4.02 Per 1000 people | 2023 | |
| CroatiaHRV | 3.91 Per 1000 people | 2022 | |
| ParaguayPRY | 3.89 Per 1000 people | 2022 | |
| NetherlandsNLD | 3.88 Per 1000 people | 2022 | |
| IrelandIRL | 3.88 Per 1000 people | 2023 | |
| IsraelISR | 3.8 Per 1000 people | 2023 | |
| KazakhstanKAZ | 3.75 Per 1000 people | 2023 | |
| Slovak RepublicSVK | 3.7 Per 1000 people | 2022 | |
| United StatesUSA | 3.68 Per 1000 people | 2022 | |
| Korea, Dem. People's Rep.PRK | 3.63 Per 1000 people | 2017 | |
| RomaniaROU | 3.63 Per 1000 people | 2022 | |
| New ZealandNZL | 3.61 Per 1000 people | 2022 | |
| FinlandFIN | 3.61 Per 1000 people | 2021 | |
| BelgiumBEL | 3.57 Per 1000 people | 2022 | |
| CyprusCYP | 3.56 Per 1000 people | 2022 | |
| UkraineUKR | 3.53 Per 1000 people | 2023 | |
| EstoniaEST | 3.47 Per 1000 people | 2022 | |
| HungaryHUN | 3.46 Per 1000 people | 2022 | |
| Saudi ArabiaSAU | 3.41 Per 1000 people | 2023 | |
| LatviaLVA | 3.4 Per 1000 people | 2022 |
Source: World Bank (WB WDI)