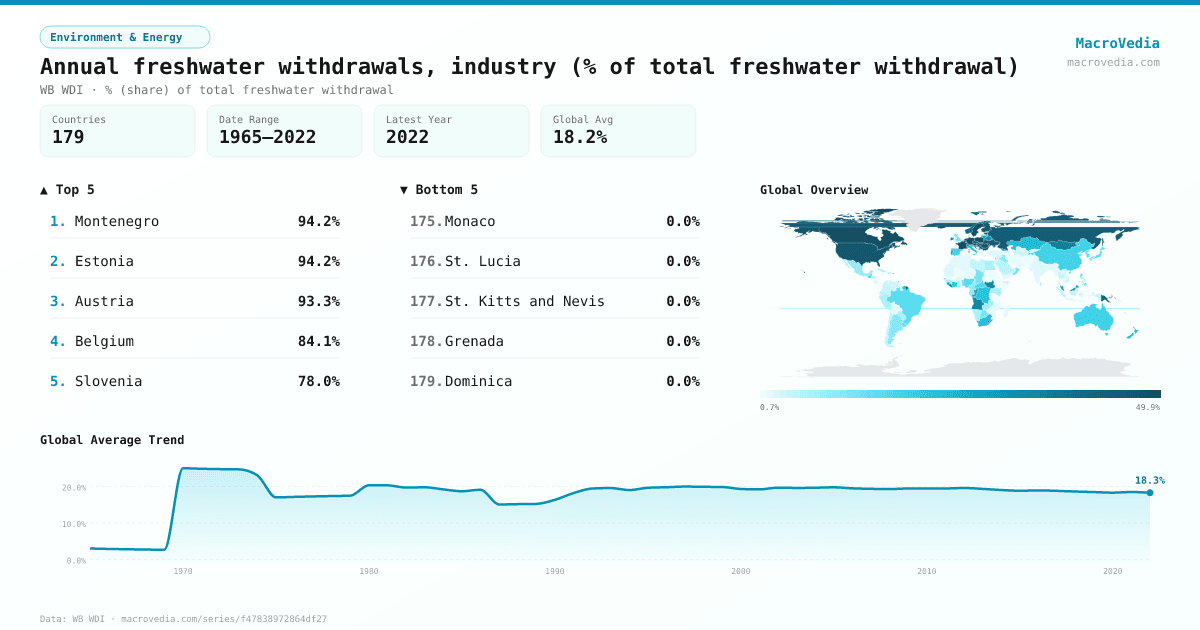
Annual freshwater withdrawals, industry (% of total freshwater withdrawal)
Environment & EnergyWB WDIwb_wdi:ER.H2O.FWIN.ZS•% (share) of total freshwater withdrawal•1965 → 2022•179 countries
Series quick facts
High-level context for this country series.
Environment & EnergyWB WDI
Coverage
179
Frequency
yearly
Range
1965 \u2192 2022
Latest
2022
Annual freshwater withdrawals, industry (% of total freshwater withdrawal) by country
Latest available value per country (as of 2022)
Low \u2192 High
Unit: %
≤ 1.43%
1.43% – 2.82%
2.82% – 5.99%
5.99% – 11.37%
11.37% – 21.51%
21.51% – 44.82%
> 44.82%
No data
Generated by MacroVedia.comSource: World Bank (WB WDI)
Highest 15 countries
Annual freshwater withdrawals, industry (% of total freshwater withdrawal)
50 countries with data
Generated by MacroVedia.comSource: World Bank (WB WDI)
Distribution across countries
Annual freshwater withdrawals, industry (% of total freshwater withdrawal)
Countries
50
Median
45%
Mean
49.2%
25th pctl
30.4%
75th pctl
70.2%
Generated by MacroVedia.comSource: World Bank (WB WDI)
Compare trends
Annual freshwater withdrawals, industry (% of total freshwater withdrawal)
HungarySwedenRomania
Generated by MacroVedia.comSource: World Bank (WB WDI)
| Country | Latest | Date | Trend |
|---|---|---|---|
| MontenegroMNE | 94.2% | 2022 | |
| EstoniaEST | 94.19% | 2022 | |
| AustriaAUT | 93.31% | 2022 | |
| BelgiumBEL | 84.11% | 2022 | |
| SloveniaSVN | 77.99% | 2022 | |
| SerbiaSRB | 77.92% | 2022 | |
| CanadaCAN | 75.81% | 2022 | |
| HungaryHUN | 75.66% | 2022 | |
| MoldovaMDA | 73.06% | 2022 | |
| Puerto Rico (US)PRI | 72.22% | 2022 | |
| BulgariaBGR | 71.26% | 2022 | |
| IcelandISL | 71.15% | 2022 | |
| NetherlandsNLD | 70.25% | 2022 | |
| FranceFRA | 68.13% | 2022 | |
| PolandPOL | 65.49% | 2022 | |
| SwedenSWE | 61.27% | 2022 | |
| GermanyDEU | 54.3% | 2022 | |
| CzechiaCZE | 53.67% | 2022 | |
| LebanonLBN | 48.91% | 2022 | |
| RomaniaROU | 48.34% | 2022 | |
| United StatesUSA | 47.2% | 2022 | |
| CroatiaHRV | 46.75% | 2022 | |
| FinlandFIN | 46.41% | 2022 | |
| LesothoLSO | 45.66% | 2022 | |
| SingaporeSGP | 45.07% | 2022 | |
| UkraineUKR | 44.84% | 2022 | |
| Russian FederationRUS | 44.79% | 2022 | |
| Papua New GuineaPNG | 42.74% | 2022 | |
| Slovak RepublicSVK | 39.84% | 2022 | |
| NorwayNOR | 39.82% | 2022 | |
| SwitzerlandCHE | 37.09% | 2022 | |
| LiberiaLBR | 36.6% | 2022 | |
| MongoliaMNG | 35.94% | 2022 | |
| South SudanSSD | 34.19% | 2022 | |
| AngolaAGO | 33.95% | 2022 | |
| Trinidad and TobagoTTO | 33.64% | 2022 | |
| IrelandIRL | 31.79% | 2022 | |
| BelarusBLR | 30.41% | 2022 | |
| MalaysiaMYS | 29.9% | 2022 | |
| PortugalPRT | 29.66% | 2022 | |
| LithuaniaLTU | 29.28% | 2022 | |
| SeychellesSYC | 27.74% | 2022 | |
| GeorgiaGEO | 27.41% | 2022 | |
| Congo, Rep.COG | 26.17% | 2022 | |
| Sierra LeoneSLE | 26.15% | 2022 | |
| New ZealandNZL | 23.98% | 2022 | |
| KazakhstanKAZ | 23.85% | 2022 | |
| South AfricaZAF | 23.16% | 2022 | |
| ItalyITA | 22.75% | 2022 | |
| SurinameSUR | 22% | 2022 |
Source: World Bank (WB WDI)