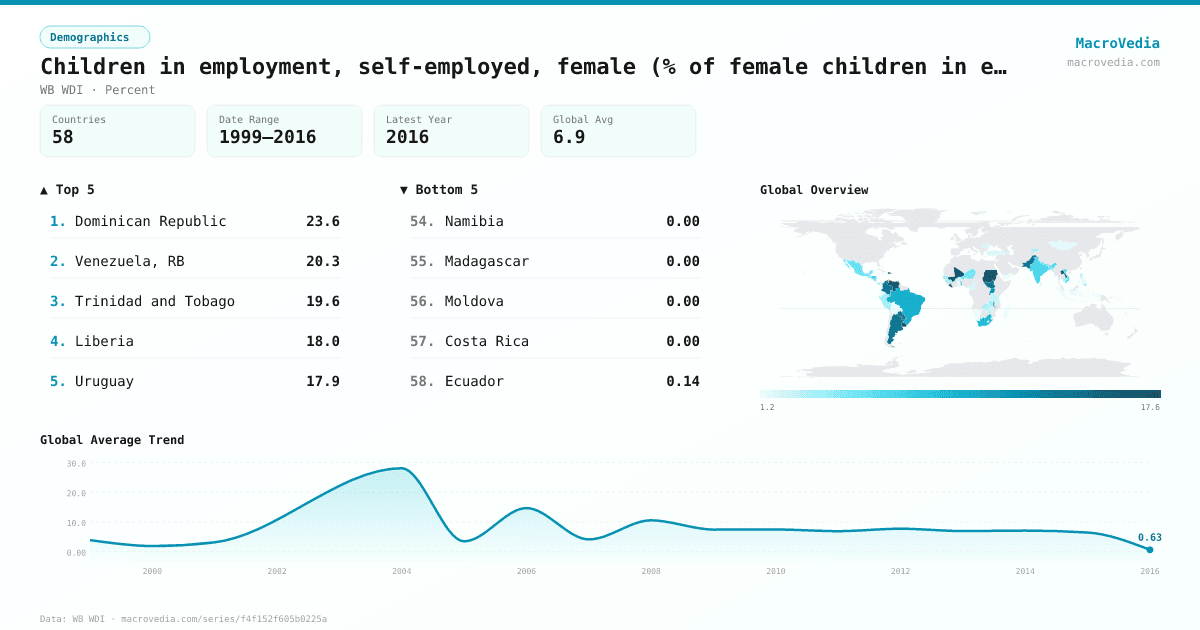
Children in employment, self-employed, female (% of female children in employment, ages 7-
DemographicsWB WDIwb_wdi:SL.SLF.0714.FE.ZS•Percent•1999 → 2016•58 countries
Series quick facts
High-level context for this country series.
DemographicsWB WDI
Coverage
58
Frequency
—
Range
1999 \u2192 2016
Latest
2015
Children in employment, self-employed, female (% of female children in employment, ages 7- by country
Latest available value per country (as of 2015)
Low \u2192 High
Unit: %
≤ 1.71%
1.71% – 3.07%
3.07% – 4.56%
4.56% – 5.95%
5.95% – 9.59%
9.59% – 15.79%
> 15.79%
No data
Generated by MacroVedia.comSource: World Bank (WB WDI)
Highest 15 countries
Children in employment, self-employed, female (% of female children in employment, ages 7-
50 countries with data
Generated by MacroVedia.comSource: World Bank (WB WDI)
Distribution across countries
Children in employment, self-employed, female (% of female children in employment, ages 7-
Countries
50
Median
5.9%
Mean
8.8%
25th pctl
3.8%
75th pctl
13.9%
Generated by MacroVedia.comSource: World Bank (WB WDI)
Compare trends
Children in employment, self-employed, female (% of female children in employment, ages 7-
ColombiaBrazilHonduras
Generated by MacroVedia.comSource: World Bank (WB WDI)
| Country | Latest | Date | Trend |
|---|---|---|---|
| ArgentinaARG | 28.06% | 2004 | — |
| Dominican RepublicDOM | 23.62% | 2012 | |
| Venezuela, RBVEN | 20.31% | 2013 | |
| Trinidad and TobagoTTO | 19.56% | 2006 | — |
| LiberiaLBR | 18.04% | 2010 | — |
| UruguayURY | 17.93% | 2009 | — |
| Lao PDRLAO | 17.88% | 2010 | — |
| SudanSDN | 17.49% | 2008 | — |
| MaliMLI | 16.02% | 2007 | — |
| South SudanSSD | 14.42% | 2008 | — |
| PakistanPAK | 14.3% | 2011 | — |
| ColombiaCOL | 13.9% | 2015 | |
| ParaguayPRY | 13.87% | 2014 | |
| RwandaRWA | 13.53% | 2011 | |
| UgandaUGA | 11.79% | 2012 | |
| MalawiMWI | 10.23% | 2015 | — |
| BrazilBRA | 9.68% | 2015 | |
| PanamaPAN | 9.36% | 2012 | |
| TogoTGO | 8.73% | 2010 | — |
| South AfricaZAF | 8.72% | 1999 | — |
| HondurasHND | 8.61% | 2014 | |
| Costa RicaCRI | 8.3% | 2011 | — |
| CambodiaKHM | 8.1% | 2009 | — |
| IndiaIND | 6.59% | 2012 | |
| Viet NamVNM | 6.03% | 2012 | — |
| BangladeshBGD | 5.84% | 2013 | — |
| NepalNPL | 5.71% | 2008 | |
| MexicoMEX | 5.48% | 2013 | |
| MongoliaMNG | 5.36% | 2007 | — |
| NicaraguaNIC | 5.35% | 2012 | |
| Gambia, TheGMB | 5.22% | 2015 | — |
| TanzaniaTZA | 5.05% | 2011 | |
| NigerNER | 4.75% | 2009 | |
| GuatemalaGTM | 4.43% | 2015 | |
| EcuadorECU | 4.38% | 2011 | — |
| GuineaGIN | 4.16% | 2010 | — |
| SenegalSEN | 3.99% | 2011 | — |
| Kyrgyz RepublicKGZ | 3.81% | 2014 | |
| El SalvadorSLV | 3.59% | 2013 | |
| PhilippinesPHL | 3.3% | 2011 | |
| PeruPER | 3.16% | 2007 | — |
| ZambiaZMB | 3.03% | 2008 | — |
| ZimbabweZWE | 2.5% | 1999 | — |
| Burkina FasoBFA | 2.46% | 2006 | — |
| AzerbaijanAZE | 2.2% | 2005 | — |
| CameroonCMR | 1.92% | 2007 | — |
| RomaniaROU | 1.87% | 2000 | — |
| AlbaniaALB | 1.77% | 2010 | — |
| Sri LankaLKA | 1.75% | 2009 | — |
| TurkiyeTUR | 1.7% | 2006 | — |
Source: World Bank (WB WDI)