People using safely managed drinking water services (% of population)
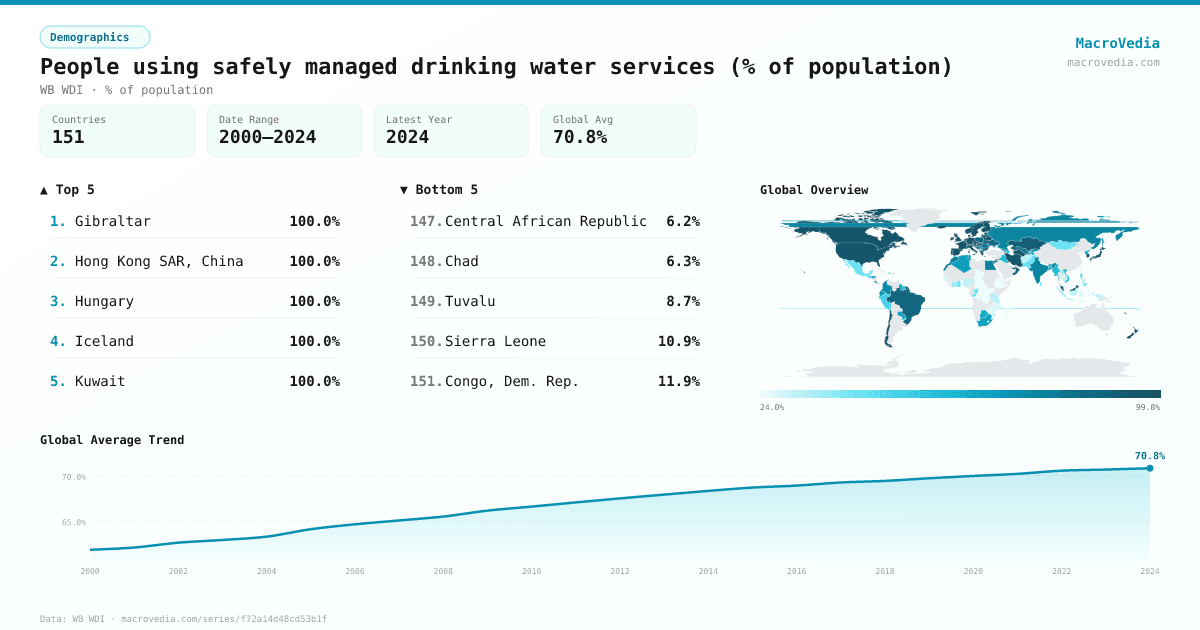
DemographicsWB WDIwb_wdi:SH.H2O.SMDW.ZS•% of population•2000 → 2024•151 countries
Series quick facts
High-level context for this country series.
DemographicsWB WDI
Coverage
151
Frequency
yearly
Range
2000 \u2192 2024
Latest
2024
People using safely managed drinking water services (% of population) by country
Latest available value per country (as of 2024)
Low \u2192 High
Unit: %
≤ 30.19%
30.19% – 49.34%
49.34% – 70.6%
70.6% – 88.66%
88.66% – 96.74%
96.74% – 99.62%
> 99.62%
No data
Generated by MacroVedia.comSource: World Bank (WB WDI)
Highest 15 countries
People using safely managed drinking water services (% of population)
50 countries with data
Generated by MacroVedia.comSource: World Bank (WB WDI)
Distribution across countries
People using safely managed drinking water services (% of population)
Countries
50
Median
99.5%
Mean
98.8%
25th pctl
97.8%
75th pctl
99.9%
Generated by MacroVedia.comSource: World Bank (WB WDI)
Compare trends
People using safely managed drinking water services (% of population)
GibraltarHong Kong SAR, ChinaHungary
Generated by MacroVedia.comSource: World Bank (WB WDI)
| Country | Latest | Date | Trend |
|---|---|---|---|
| GibraltarGIB | 100% | 2024 | |
| Hong Kong SAR, ChinaHKG | 100% | 2024 | |
| HungaryHUN | 100% | 2024 | |
| IcelandISL | 100% | 2024 | |
| KuwaitKWT | 100% | 2024 | |
| LiechtensteinLIE | 100% | 2024 | |
| Macao SAR, ChinaMAC | 100% | 2024 | |
| MonacoMCO | 100% | 2024 | |
| New ZealandNZL | 100% | 2024 | |
| SingaporeSGP | 100% | 2024 | |
| San MarinoSMR | 100% | 2024 | |
| NetherlandsNLD | 99.96% | 2024 | |
| DenmarkDNK | 99.92% | 2024 | |
| GermanyDEU | 99.92% | 2024 | |
| Isle of ManIMN | 99.91% | 2024 | |
| MaltaMLT | 99.83% | 2024 | |
| United KingdomGBR | 99.82% | 2024 | |
| SwedenSWE | 99.76% | 2024 | |
| CyprusCYP | 99.72% | 2024 | |
| FranceFRA | 99.71% | 2024 | |
| LuxembourgLUX | 99.65% | 2024 | |
| FinlandFIN | 99.65% | 2024 | |
| SloveniaSVN | 99.57% | 2024 | |
| Slovak RepublicSVK | 99.57% | 2024 | |
| BelgiumBEL | 99.55% | 2024 | |
| IsraelISR | 99.46% | 2024 | |
| SpainESP | 99.46% | 2024 | |
| Korea, Rep.KOR | 99.28% | 2024 | |
| NorwayNOR | 99.06% | 2024 | |
| EstoniaEST | 98.94% | 2024 | |
| Puerto Rico (US)PRI | 98.94% | 2024 | |
| BahrainBHR | 98.9% | 2024 | |
| AustriaAUT | 98.89% | 2024 | |
| JapanJPN | 98.73% | 2024 | |
| Virgin Islands (U.S.)VIR | 98.68% | 2024 | |
| United Arab EmiratesARE | 98.64% | 2024 | |
| CzechiaCZE | 98.14% | 2024 | |
| ChileCHL | 97.82% | 2024 | |
| United StatesUSA | 97.57% | 2024 | |
| LatviaLVA | 97.01% | 2024 | |
| CanadaCAN | 96.89% | 2024 | |
| New CaledoniaNCL | 96.87% | 2024 | |
| ItalyITA | 96.76% | 2024 | |
| LithuaniaLTU | 96.73% | 2024 | |
| SwitzerlandCHE | 96.7% | 2024 | |
| GreeceGRC | 96.69% | 2024 | |
| St. Martin (French part)MAF | 96.63% | 2024 | |
| BulgariaBGR | 96.21% | 2024 | |
| IrelandIRL | 96.13% | 2024 | |
| QatarQAT | 95.35% | 2024 |
Source: World Bank (WB WDI)