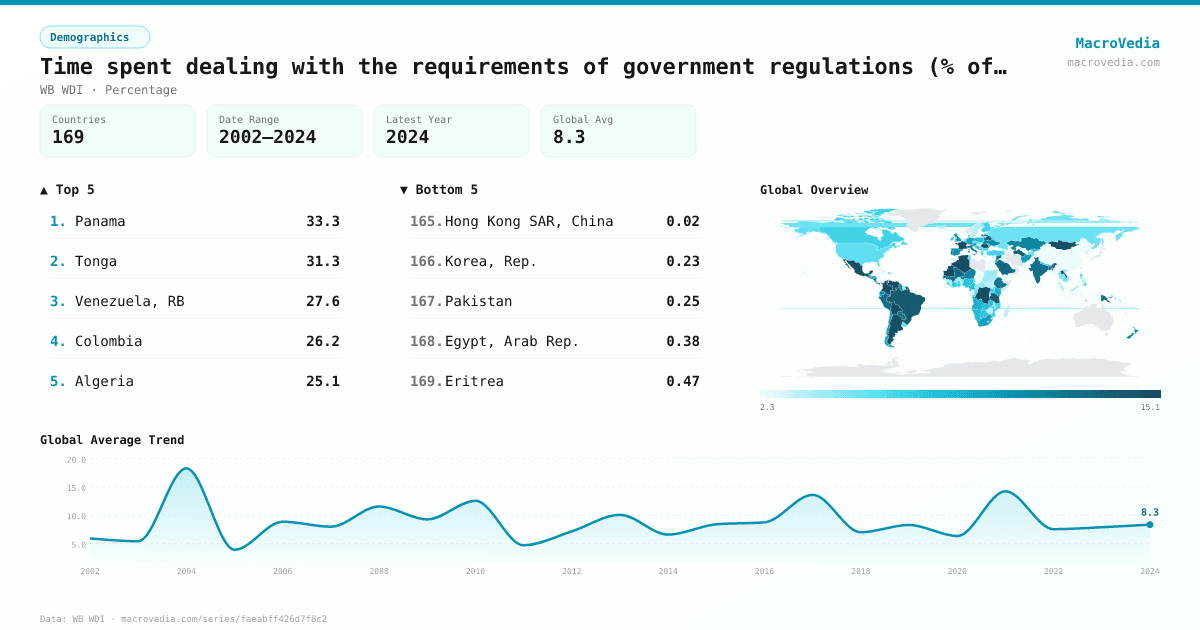
Time spent dealing with the requirements of government regulations (% of senior management time)
DemographicsWB WDIwb_wdi:IC.GOV.DURS.ZS•Percentage•2002 → 2024•169 countries
Series quick facts
High-level context for this country series.
DemographicsWB WDI
Coverage
169
Frequency
—
Range
2002 \u2192 2024
Latest
2024
Time spent dealing with the requirements of government regulations (% of senior management time) by country
Latest available value per country (as of 2024)
Low \u2192 High
Unit: %
≤ 4.1%
4.1% – 6.16%
6.16% – 7.68%
7.68% – 9.88%
9.88% – 13.02%
13.02% – 18.02%
> 18.02%
No data
Generated by MacroVedia.comSource: World Bank (WB WDI)
Highest 15 countries
Time spent dealing with the requirements of government regulations (% of senior management time)
50 countries with data
Generated by MacroVedia.comSource: World Bank (WB WDI)
Distribution across countries
Time spent dealing with the requirements of government regulations (% of senior management time)
Countries
50
Median
18%
Mean
18.9%
25th pctl
14.2%
75th pctl
21%
Generated by MacroVedia.comSource: World Bank (WB WDI)
Compare trends
Time spent dealing with the requirements of government regulations (% of senior management time)
RomaniaLatviaLao PDR
Generated by MacroVedia.comSource: World Bank (WB WDI)
| Country | Latest | Date | Trend |
|---|---|---|---|
| PanamaPAN | 33.3% | 2010 | |
| TongaTON | 31.33% | 2024 | |
| BhutanBTN | 28.76% | 2015 | |
| BoliviaBOL | 28.48% | 2010 | |
| Venezuela, RBVEN | 27.63% | 2010 | |
| MaliMLI | 27.53% | 2016 | |
| LatviaLVA | 26.77% | 2019 | |
| ColombiaCOL | 26.17% | 2023 | |
| AlgeriaDZA | 25.1% | 2007 | — |
| NigerNER | 22.92% | 2009 | |
| Burkina FasoBFA | 22.2% | 2009 | |
| Cabo VerdeCPV | 21.34% | 2024 | |
| El SalvadorSLV | 20.98% | 2023 | |
| MadagascarMDG | 20.84% | 2013 | |
| FranceFRA | 20.7% | 2021 | — |
| ArgentinaARG | 20.51% | 2017 | |
| NicaraguaNIC | 20.16% | 2010 | |
| Lao PDRLAO | 19.95% | 2024 | |
| PolandPOL | 19.51% | 2013 | |
| UruguayURY | 19.16% | 2017 | |
| UkraineUKR | 19.1% | 2013 | |
| Congo, Dem. Rep.COD | 19.03% | 2024 | |
| MongoliaMNG | 18.53% | 2019 | |
| SeychellesSYC | 18.39% | 2023 | — |
| South SudanSSD | 18.02% | 2014 | — |
| CameroonCMR | 17.93% | 2016 | |
| Timor-LesteTLS | 17.22% | 2021 | |
| MauritaniaMRT | 17.16% | 2014 | |
| HondurasHND | 16.98% | 2010 | |
| Slovak RepublicSVK | 16.47% | 2019 | |
| CambodiaKHM | 16.42% | 2016 | |
| MexicoMEX | 15.81% | 2023 | |
| MoroccoMAR | 15.21% | 2019 | |
| Cote d'IvoireCIV | 15.18% | 2016 | |
| RomaniaROU | 15.07% | 2023 | |
| CroatiaHRV | 15.04% | 2019 | |
| Russian FederationRUS | 14.73% | 2012 | |
| BrazilBRA | 14.18% | 2009 | — |
| IrelandIRL | 13.92% | 2020 | |
| SamoaWSM | 13.88% | 2009 | — |
| TanzaniaTZA | 13.59% | 2023 | |
| TurkmenistanTKM | 13.52% | 2024 | — |
| ChadTCD | 13.31% | 2018 | |
| BangladeshBGD | 13.3% | 2022 | |
| BelarusBLR | 13.29% | 2018 | |
| PortugalPRT | 13.18% | 2023 | |
| CzechiaCZE | 13.17% | 2019 | |
| Sierra LeoneSLE | 13.06% | 2017 | |
| Papua New GuineaPNG | 13.02% | 2024 | |
| Saudi ArabiaSAU | 13% | 2022 | — |
Source: World Bank (WB WDI)