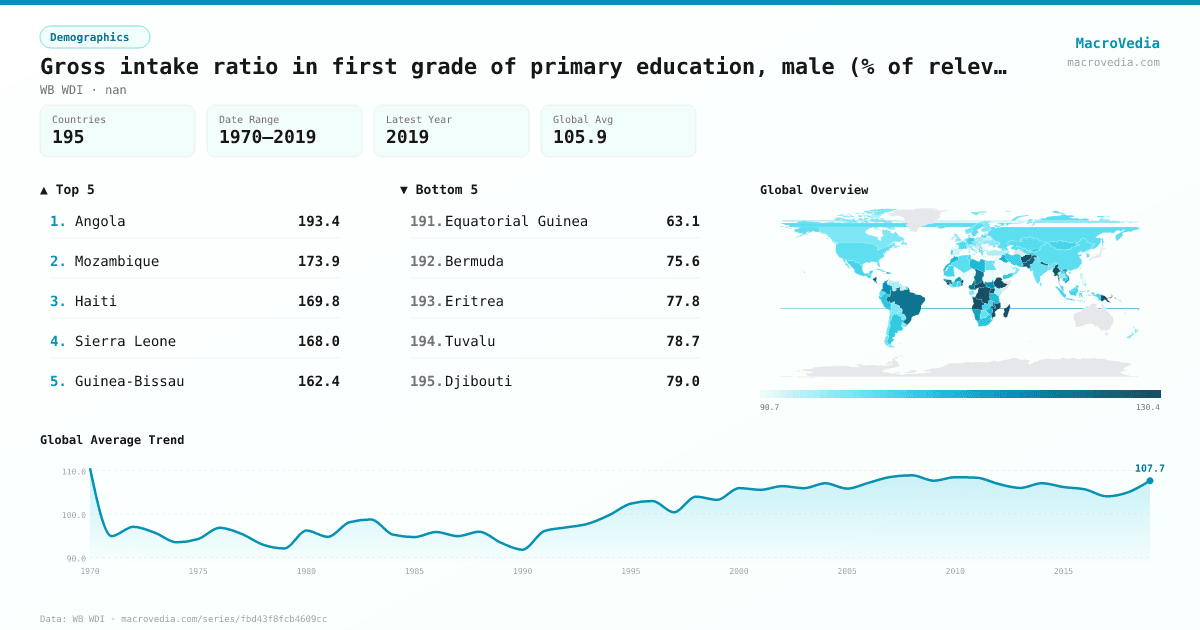
Gross intake ratio in first grade of primary education, male (% of relevant age group)
DemographicsWB WDIwb_wdi:SE.PRM.GINT.MA.ZS•nan•1970 → 2019•195 countries
Series quick facts
High-level context for this country series.
DemographicsWB WDI
Coverage
195
Frequency
—
Range
1970 \u2192 2019
Latest
2019
Gross intake ratio in first grade of primary education, male (% of relevant age group) by country
Latest available value per country (as of 2019)
Low \u2192 High
Unit: %
≤ 91.62%
91.62% – 97.7%
97.7% – 100.09%
100.09% – 103.14%
103.14% – 107.03%
107.03% – 119.73%
> 119.73%
No data
Generated by MacroVedia.comSource: World Bank (WB WDI)
Highest 15 countries
Gross intake ratio in first grade of primary education, male (% of relevant age group)
50 countries with data
Generated by MacroVedia.comSource: World Bank (WB WDI)
Distribution across countries
Gross intake ratio in first grade of primary education, male (% of relevant age group)
Countries
50
Median
123.2%
Mean
129.8%
25th pctl
113.2%
75th pctl
143.5%
Generated by MacroVedia.comSource: World Bank (WB WDI)
Compare trends
Gross intake ratio in first grade of primary education, male (% of relevant age group)
LesothoBeninBurkina Faso
Generated by MacroVedia.comSource: World Bank (WB WDI)
| Country | Latest | Date | Trend |
|---|---|---|---|
| AngolaAGO | 193.42% | 2011 | |
| MozambiqueMOZ | 173.88% | 2018 | |
| HaitiHTI | 169.76% | 1997 | |
| Sierra LeoneSLE | 167.99% | 2018 | |
| Guinea-BissauGNB | 162.41% | 2010 | |
| MadagascarMDG | 153.9% | 2018 | |
| EthiopiaETH | 153.56% | 2015 | |
| British Virgin IslandsVGB | 150.3% | 2017 | |
| BeninBEN | 150.23% | 2018 | |
| NicaraguaNIC | 146.23% | 2010 | |
| NepalNPL | 145.7% | 2019 | |
| Congo, Dem. Rep.COD | 145.05% | 2015 | |
| TogoTGO | 143.53% | 2018 | |
| NauruNRU | 141.98% | 2016 | |
| Central African RepublicCAF | 140.34% | 2016 | |
| MyanmarMMR | 139.95% | 2017 | |
| UgandaUGA | 139.24% | 2017 | |
| MalawiMWI | 131.01% | 2018 | |
| Papua New GuineaPNG | 130.99% | 2016 | |
| RwandaRWA | 130.5% | 2018 | |
| AfghanistanAFG | 130.19% | 2018 | |
| BurundiBDI | 129.07% | 2018 | |
| PakistanPAK | 126.54% | 2018 | |
| LesothoLSO | 125.61% | 2017 | |
| GuineaGIN | 123.38% | 2016 | |
| CameroonCMR | 122.95% | 2018 | |
| BrazilBRA | 121.6% | 2004 | |
| ChadTCD | 120.95% | 2016 | |
| Sint Maarten (Dutch part)SXM | 119.25% | 2014 | |
| ColombiaCOL | 115.97% | 2018 | |
| South SudanSSD | 115.38% | 2015 | |
| St. Vincent and the GrenadinesVCT | 115.21% | 2018 | |
| French PolynesiaPYF | 114.86% | 1983 | — |
| DominicaDMA | 114.73% | 2016 | |
| SamoaWSM | 114.05% | 2018 | |
| Burkina FasoBFA | 113.96% | 2018 | |
| Viet NamVNM | 113.75% | 2018 | |
| FijiFJI | 113.16% | 2016 | |
| ArubaABW | 113.01% | 2014 | |
| NamibiaNAM | 112.71% | 2018 | |
| TongaTON | 112.49% | 2013 | |
| IraqIRQ | 111.13% | 2007 | |
| MontenegroMNE | 111.03% | 2018 | |
| St. Kitts and NevisKNA | 110.54% | 2016 | |
| Hong Kong SAR, ChinaHKG | 110.5% | 2018 | |
| Costa RicaCRI | 110.49% | 2018 | |
| ZimbabweZWE | 109.18% | 2013 | |
| MoroccoMAR | 108.96% | 2018 | |
| LibyaLBY | 108.89% | 1983 | |
| TanzaniaTZA | 108.46% | 2018 |
Source: World Bank (WB WDI)