Exports of goods and services (constant 2015 US$)
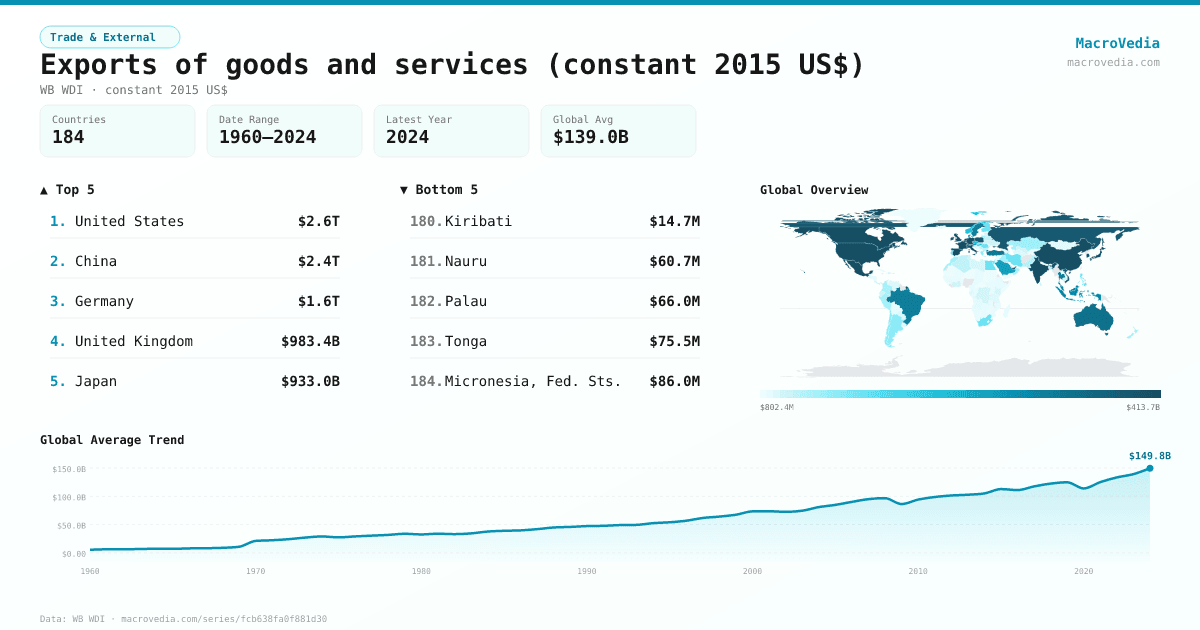
Trade & ExternalWB WDIwb_wdi:NE.EXP.GNFS.KD•constant 2015 US$•1960 → 2024•184 countries
Series quick facts
High-level context for this country series.
Trade & ExternalWB WDI
Coverage
184
Frequency
yearly
Range
1960 \u2192 2024
Latest
2024
Exports of goods and services (constant 2015 US$) by country
Latest available value per country (as of 2024)
Low \u2192 High
Unit: US$
≤ 1.6B
1.6B – 4.37B
4.37B – 9.5B
9.5B – 23.27B
23.27B – 57.13B
57.13B – 299.2B
> 299.2B
No data
Generated by MacroVedia.comSource: World Bank (WB WDI)
Highest 15 countries
Exports of goods and services (constant 2015 US$)
50 countries with data
Generated by MacroVedia.comSource: World Bank (WB WDI)
Distribution across countries
Exports of goods and services (constant 2015 US$)
Countries
50
Median
$306.15B
Mean
$474.71B
25th pctl
$124.47B
75th pctl
$588.1B
Generated by MacroVedia.comSource: World Bank (WB WDI)
Compare trends
Exports of goods and services (constant 2015 US$)
FranceKorea, Rep.Singapore
Generated by MacroVedia.comSource: World Bank (WB WDI)
| Country | Latest | Date | Trend |
|---|---|---|---|
| United StatesUSA | $2.6T | 2024 | |
| ChinaCHN | $2.36T | 2015 | — |
| GermanyDEU | $1.62T | 2024 | |
| United KingdomGBR | $983.42B | 2024 | |
| JapanJPN | $933.05B | 2024 | |
| FranceFRA | $930.46B | 2024 | |
| Korea, Rep.KOR | $858.19B | 2024 | |
| SingaporeSGP | $811.99B | 2024 | |
| NetherlandsNLD | $795.99B | 2024 | |
| IrelandIRL | $781.92B | 2024 | |
| IndiaIND | $715.33B | 2024 | |
| ItalyITA | $647.49B | 2024 | |
| Hong Kong SAR, ChinaHKG | $588.1B | 2024 | |
| CanadaCAN | $559.44B | 2024 | |
| SwitzerlandCHE | $551.6B | 2024 | |
| SpainESP | $506.88B | 2024 | |
| MexicoMEX | $496.55B | 2024 | |
| United Arab EmiratesARE | $482.66B | 2023 | |
| BelgiumBEL | $426.27B | 2024 | |
| Russian FederationRUS | $384.25B | 2022 | |
| Viet NamVNM | $383.4B | 2024 | |
| PolandPOL | $382.02B | 2024 | |
| AustraliaAUS | $326.97B | 2024 | |
| TurkiyeTUR | $311.7B | 2024 | |
| ThailandTHA | $307.45B | 2024 | |
| SwedenSWE | $304.85B | 2024 | |
| BrazilBRA | $301.09B | 2024 | |
| MalaysiaMYS | $287.87B | 2024 | |
| IndonesiaIDN | $280.36B | 2024 | |
| AustriaAUT | $249.49B | 2024 | |
| DenmarkDNK | $245.26B | 2024 | |
| Saudi ArabiaSAU | $241.5B | 2024 | |
| CzechiaCZE | $191.3B | 2024 | |
| NorwayNOR | $177.01B | 2024 | |
| HungaryHUN | $175.39B | 2024 | |
| LuxembourgLUX | $135.14B | 2024 | |
| PhilippinesPHL | $129.06B | 2024 | |
| IsraelISR | $124.47B | 2024 | |
| PortugalPRT | $114.94B | 2024 | |
| Iran, Islamic Rep.IRN | $110.58B | 2024 | |
| RomaniaROU | $109.66B | 2024 | |
| Egypt, Arab Rep.EGY | $106.82B | 2024 | |
| FinlandFIN | $105.7B | 2024 | |
| South AfricaZAF | $101.62B | 2024 | |
| Slovak RepublicSVK | $99.46B | 2024 | |
| QatarQAT | $92.29B | 2015 | — |
| GreeceGRC | $82.8B | 2024 | |
| ArgentinaARG | $77.17B | 2024 | |
| ChileCHL | $75.7B | 2024 | |
| Puerto Rico (US)PRI | $69.46B | 2015 | — |
Source: World Bank (WB WDI)