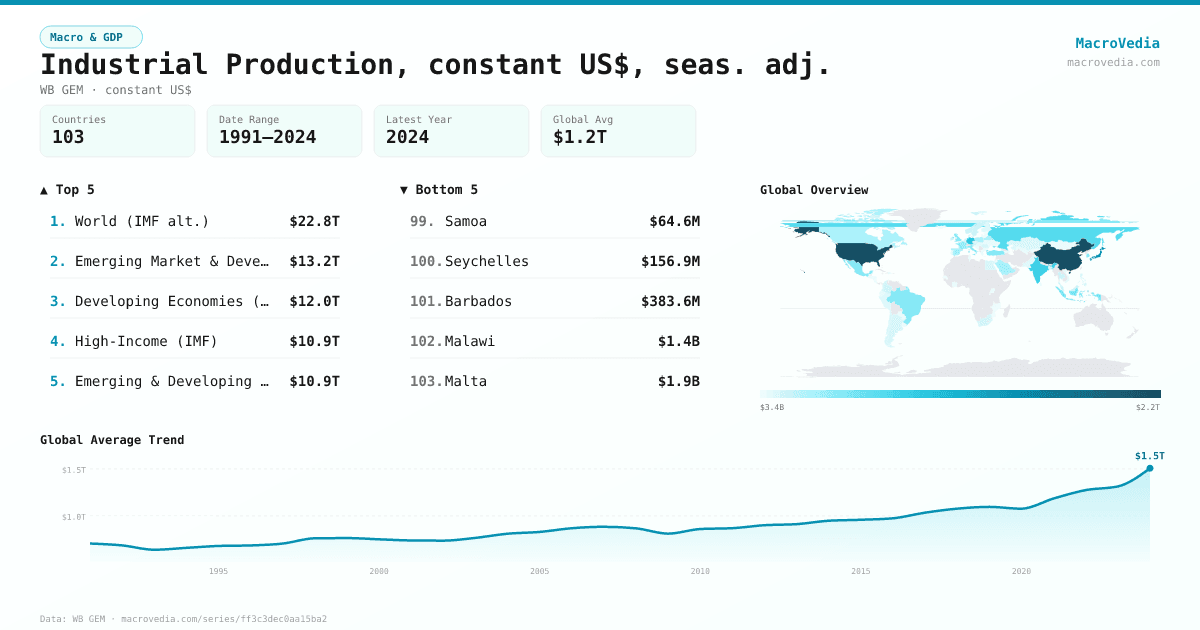
Industrial Production, constant US$, seas. adj.
Macro & GDPWB GEMwb_gem:IPTOTSAKD•constant US$•1991 → 2024•89 countries
Series quick facts
High-level context for this country series.
Macro & GDPWB GEM
Coverage
89
Frequency
yearly
Range
1991 \u2192 2024
Latest
2024
Industrial Production, constant US$, seas. adj. by country
Latest available value per country (as of 2024)
Low \u2192 High
Unit: US$
≤ 4.19B
4.19B – 12.62B
12.62B – 24.29B
24.29B – 83.82B
83.82B – 140.77B
140.77B – 385.31B
> 385.31B
No data
Generated by MacroVedia.comSource: World Bank (WB GEM)
Highest 15 countries
Industrial Production, constant US$, seas. adj.
50 countries with data
Generated by MacroVedia.comSource: World Bank (WB GEM)
Distribution across countries
Industrial Production, constant US$, seas. adj.
Countries
50
Median
$142.43B
Mean
$459.92B
25th pctl
$84.81B
75th pctl
$423.15B
Generated by MacroVedia.comSource: World Bank (WB GEM)
Compare trends
Industrial Production, constant US$, seas. adj.
United StatesJapanGermany
Generated by MacroVedia.comSource: World Bank (WB GEM)
| Country | Latest | Date | Trend |
|---|---|---|---|
| ChinaCHN | $7.73T | 2024 | |
| United StatesUSA | $3.34T | 2024 | |
| JapanJPN | $1.49T | 2024 | |
| GermanyDEU | $937.61B | 2024 | |
| IndiaIND | $813.88B | 2024 | |
| Russian FederationRUS | $674.23B | 2024 | |
| Korea, Rep.KOR | $522.3B | 2024 | |
| IndonesiaIDN | $515.91B | 2024 | |
| United KingdomGBR | $459.51B | 2024 | |
| BrazilBRA | $451.23B | 2024 | |
| TurkiyeTUR | $434.2B | 2024 | |
| ItalyITA | $429.52B | 2024 | |
| MexicoMEX | $423.15B | 2024 | |
| FranceFRA | $356.93B | 2024 | |
| SpainESP | $333.06B | 2024 | |
| Saudi ArabiaSAU | $304.44B | 2023 | |
| BelarusBLR | $285B | 2024 | |
| CanadaCAN | $265.88B | 2024 | |
| PolandPOL | $264.59B | 2024 | |
| IrelandIRL | $191.64B | 2024 | |
| MalaysiaMYS | $160.29B | 2024 | |
| NetherlandsNLD | $158.41B | 2024 | |
| NorwayNOR | $148.06B | 2024 | |
| ThailandTHA | $147.59B | 2024 | |
| SwedenSWE | $142.55B | 2024 | |
| AustriaAUT | $142.31B | 2024 | |
| BelgiumBEL | $131.52B | 2024 | |
| ColombiaCOL | $116.3B | 2024 | |
| SingaporeSGP | $113.29B | 2024 | |
| PhilippinesPHL | $113.12B | 2024 | |
| DenmarkDNK | $106.03B | 2024 | |
| South AfricaZAF | $105.47B | 2024 | |
| BangladeshBGD | $99.48B | 2021 | |
| ArgentinaARG | $95.02B | 2023 | |
| RomaniaROU | $94.53B | 2024 | |
| CzechiaCZE | $94.14B | 2024 | |
| Egypt, Arab Rep.EGY | $89.3B | 2024 | |
| ChileCHL | $84.81B | 2024 | |
| KazakhstanKAZ | $83.43B | 2024 | |
| QatarQAT | $79B | 2023 | |
| FinlandFIN | $73.12B | 2024 | |
| PeruPER | $62.57B | 2024 | |
| PakistanPAK | $55.02B | 2024 | |
| IsraelISR | $53.52B | 2024 | |
| Viet NamVNM | $49.97B | 2024 | |
| HungaryHUN | $48.43B | 2024 | |
| PortugalPRT | $44.07B | 2024 | |
| Slovak RepublicSVK | $34.53B | 2024 | |
| EcuadorECU | $27.96B | 2019 | |
| GreeceGRC | $25.34B | 2024 |
Source: World Bank (WB GEM)