Number of surgical procedures (per 100,000 population)
HealthWB WDIwb_wdi:SH.SGR.PROC.P5•Per 100,000 population•2002 → 2023•123 countries
Series quick facts
High-level context for this country series.
HealthWB WDI
Coverage
123
Frequency
—
Range
2002 \u2192 2023
Latest
2023
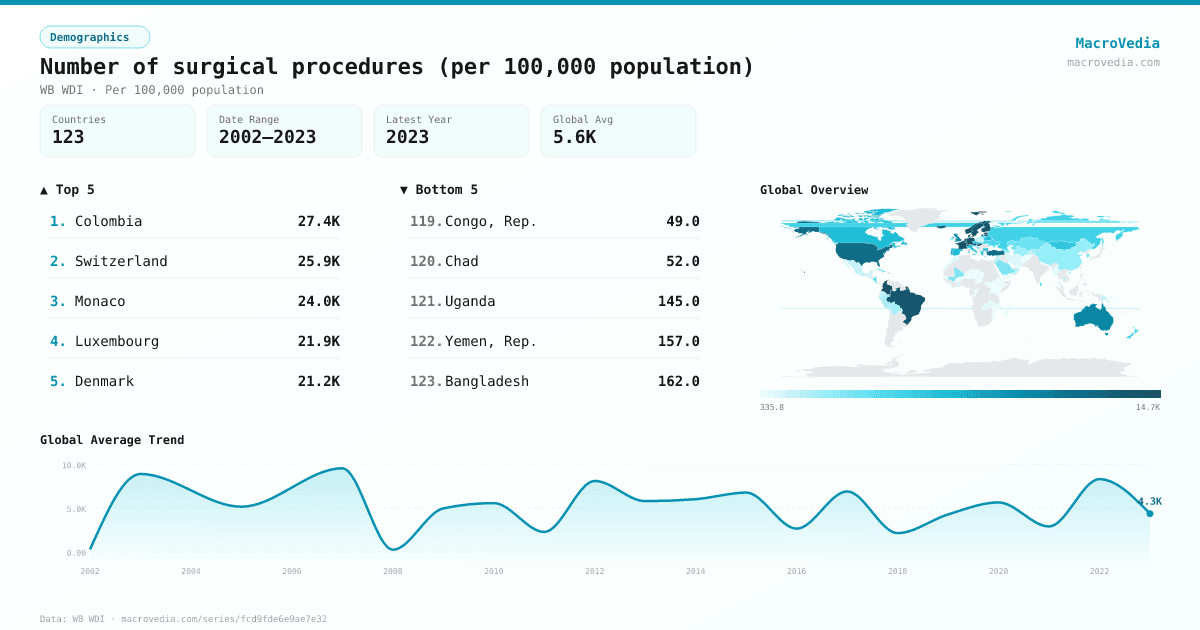
Number of surgical procedures (per 100,000 population) by country
Latest available value per country (as of 2023)
Low \u2192 High
Unit: Per 100,000 population
≤ 445.43
445.43 – 1.55K
1.55K – 2.69K
2.69K – 4.26K
4.26K – 6.92K
6.92K – 13.48K
> 13.48K
No data
Generated by MacroVedia.comSource: World Bank (WB WDI)
Highest 15 countries
Number of surgical procedures (per 100,000 population)
123 countries with data
Generated by MacroVedia.comSource: World Bank (WB WDI)
Distribution across countries
Number of surgical procedures (per 100,000 population)
Countries
123
Median
3.3K
Mean
5.8K
25th pctl
1.3K
75th pctl
7.1K
Generated by MacroVedia.comSource: World Bank (WB WDI)
Compare trends
Number of surgical procedures (per 100,000 population)
SwedenUnited KingdomSpain
Generated by MacroVedia.comSource: World Bank (WB WDI)
| Country | Latest | Date | Trend |
|---|---|---|---|
| AustraliaAUS | 28.91K Per 100,000 population | 2015 | — |
| ColombiaCOL | 27.39K Per 100,000 population | 2015 | — |
| SwitzerlandCHE | 25.92K Per 100,000 population | 2012 | — |
| MonacoMCO | 23.99K Per 100,000 population | 2020 | — |
| LuxembourgLUX | 21.93K Per 100,000 population | 2012 | — |
| DenmarkDNK | 21.2K Per 100,000 population | 2015 | — |
| BelgiumBEL | 20.71K Per 100,000 population | 2013 | — |
| GermanyDEU | 19.12K Per 100,000 population | 2022 | |
| LatviaLVA | 18.4K Per 100,000 population | 2015 | — |
| NorwayNOR | 17.4K Per 100,000 population | 2003 | — |
| NetherlandsNLD | 16.64K Per 100,000 population | 2012 | — |
| FranceFRA | 16.31K Per 100,000 population | 2012 | — |
| FinlandFIN | 15.87K Per 100,000 population | 2022 | |
| EstoniaEST | 14.83K Per 100,000 population | 2022 | |
| SwedenSWE | 14.38K Per 100,000 population | 2022 | |
| HungaryHUN | 13.83K Per 100,000 population | 2010 | — |
| AustriaAUT | 13.8K Per 100,000 population | 2014 | — |
| BrazilBRA | 13.67K Per 100,000 population | 2015 | — |
| MaltaMLT | 13.23K Per 100,000 population | 2012 | — |
| IcelandISL | 13.19K Per 100,000 population | 2009 | — |
| United StatesUSA | 12.09K Per 100,000 population | 2007 | — |
| TurkiyeTUR | 11.91K Per 100,000 population | 2010 | — |
| United KingdomGBR | 10.49K Per 100,000 population | 2014 | |
| LithuaniaLTU | 10.19K Per 100,000 population | 2015 | — |
| Slovak RepublicSVK | 9.79K Per 100,000 population | 2018 | |
| Isle of ManIMN | 9.77K Per 100,000 population | 2014 | — |
| Cayman IslandsCYM | 8.77K Per 100,000 population | 2015 | — |
| PalauPLW | 8.61K Per 100,000 population | 2020 | — |
| PortugalPRT | 8.44K Per 100,000 population | 2011 | — |
| SloveniaSVN | 7.58K Per 100,000 population | 2010 | — |
| NaoeroNRU | 7.13K Per 100,000 population | 2016 | — |
| GreeceGRC | 6.99K Per 100,000 population | 2007 | — |
| SpainESP | 6.95K Per 100,000 population | 2023 | |
| BelarusBLR | 6.95K Per 100,000 population | 2020 | |
| CanadaCAN | 6.93K Per 100,000 population | 2021 | — |
| ItalyITA | 6.92K Per 100,000 population | 2012 | — |
| BulgariaBGR | 6.76K Per 100,000 population | 2010 | |
| MongoliaMNG | 6.29K Per 100,000 population | 2020 | |
| CzechiaCZE | 6.27K Per 100,000 population | 2012 | — |
| Russian FederationRUS | 5.44K Per 100,000 population | 2020 | |
| New ZealandNZL | 5.31K Per 100,000 population | 2016 | — |
| AndorraAND | 5.24K Per 100,000 population | 2014 | — |
| UkraineUKR | 5.14K Per 100,000 population | 2019 | |
| ArmeniaARM | 5.08K Per 100,000 population | 2020 | |
| TongaTON | 5.06K Per 100,000 population | 2016 | — |
| SingaporeSGP | 5.05K Per 100,000 population | 2019 | — |
| Sri LankaLKA | 4.94K Per 100,000 population | 2015 | — |
| IsraelISR | 4.88K Per 100,000 population | 2014 | — |
| NicaraguaNIC | 4.86K Per 100,000 population | 2010 | — |
| CubaCUB | 4.74K Per 100,000 population | 2012 | — |
| GeorgiaGEO | 4.47K Per 100,000 population | 2020 | |
| MoldovaMDA | 4.28K Per 100,000 population | 2020 | |
| SeychellesSYC | 4.27K Per 100,000 population | 2012 | — |
| San MarinoSMR | 4.23K Per 100,000 population | 2020 | |
| MauritiusMUS | 4.05K Per 100,000 population | 2022 | |
| BahrainBHR | 4K Per 100,000 population | 2012 | — |
| KazakhstanKAZ | 3.95K Per 100,000 population | 2020 | |
| Costa RicaCRI | 3.75K Per 100,000 population | 2014 | — |
| Bosnia and HerzegovinaBIH | 3.6K Per 100,000 population | 2009 | — |
| Saudi ArabiaSAU | 3.45K Per 100,000 population | 2012 | — |
| TuvaluTUV | 3.42K Per 100,000 population | 2016 | — |
| MaliMLI | 3.32K Per 100,000 population | 2009 | — |
| Korea, Rep.KOR | 3.23K Per 100,000 population | 2022 | |
| CyprusCYP | 3.06K Per 100,000 population | 2014 | — |
| IrelandIRL | 3.05K Per 100,000 population | 2010 | — |
| BhutanBTN | 2.91K Per 100,000 population | 2022 | |
| AzerbaijanAZE | 2.83K Per 100,000 population | 2017 | |
| El SalvadorSLV | 2.8K Per 100,000 population | 2009 | — |
| ChinaCHN | 2.73K Per 100,000 population | 2012 | — |
| Macao SAR, ChinaMAC | 2.72K Per 100,000 population | 2022 | — |
| Kyrgyz RepublicKGZ | 2.68K Per 100,000 population | 2020 | |
| UzbekistanUZB | 2.62K Per 100,000 population | 2019 | |
| TurkmenistanTKM | 2.61K Per 100,000 population | 2020 | |
| St. Vincent and the GrenadinesVCT | 2.51K Per 100,000 population | 2015 | — |
| JordanJOR | 2.47K Per 100,000 population | 2015 | — |
| BoliviaBOL | 2.31K Per 100,000 population | 2010 | — |
| FijiFJI | 2.25K Per 100,000 population | 2020 | |
| AlbaniaALB | 2K Per 100,000 population | 2021 | |
| PeruPER | 1.97K Per 100,000 population | 2015 | |
| BelizeBLZ | 1.96K Per 100,000 population | 2014 | — |
| QatarQAT | 1.89K Per 100,000 population | 2009 | — |
| TajikistanTJK | 1.88K Per 100,000 population | 2018 | |
| Hong Kong SAR, ChinaHKG | 1.73K Per 100,000 population | 2023 | — |
| KiribatiKIR | 1.72K Per 100,000 population | 2016 | — |
| KosovoXKX | 1.7K Per 100,000 population | 2021 | |
| Syrian Arab RepublicSYR | 1.62K Per 100,000 population | 2010 | — |
| OmanOMN | 1.61K Per 100,000 population | 2022 | |
| EcuadorECU | 1.55K Per 100,000 population | 2015 | — |
| SamoaWSM | 1.55K Per 100,000 population | 2016 | — |
| PolandPOL | 1.52K Per 100,000 population | 2012 | — |
| CambodiaKHM | 1.36K Per 100,000 population | 2018 | — |
| JamaicaJAM | 1.31K Per 100,000 population | 2016 | — |
| MexicoMEX | 1.3K Per 100,000 population | 2015 | — |
| Papua New GuineaPNG | 1.26K Per 100,000 population | 2016 | — |
| RwandaRWA | 970.1 Per 100,000 population | 2016 | |
| BarbadosBRB | 966.3 Per 100,000 population | 2018 | — |
| GuatemalaGTM | 935.3 Per 100,000 population | 2021 | |
| GhanaGHA | 869 Per 100,000 population | 2015 | — |
| Solomon IslandsSLB | 868 Per 100,000 population | 2016 | — |
| VanuatuVUT | 860 Per 100,000 population | 2020 | |
| Iran, Islamic Rep.IRN | 802.7 Per 100,000 population | 2010 | — |
| MoroccoMAR | 746 Per 100,000 population | 2015 | — |
| ZambiaZMB | 680 Per 100,000 population | 2010 | — |
| MyanmarMMR | 668 Per 100,000 population | 2011 | — |
| LiberiaLBR | 462 Per 100,000 population | 2018 | |
| Timor-LesteTLS | 433 Per 100,000 population | 2016 | — |
| SenegalSEN | 393.5 Per 100,000 population | 2018 | — |
| MalawiMWI | 372 Per 100,000 population | 2003 | — |
| Sierra LeoneSLE | 372 Per 100,000 population | 2017 | |
| MozambiqueMOZ | 367 Per 100,000 population | 2015 | — |
| Burkina FasoBFA | 328 Per 100,000 population | 2012 | — |
| KenyaKEN | 263 Per 100,000 population | 2002 | — |
| NigerNER | 263 Per 100,000 population | 2014 | — |
| South SudanSSD | 262 Per 100,000 population | 2014 | — |
| AfghanistanAFG | 229 Per 100,000 population | 2008 | — |
| NepalNPL | 208 Per 100,000 population | 2011 | — |
| EthiopiaETH | 192 Per 100,000 population | 2013 | |
| MadagascarMDG | 163 Per 100,000 population | 2016 | — |
| BangladeshBGD | 162 Per 100,000 population | 2011 | — |
| Yemen, Rep.YEM | 157 Per 100,000 population | 2014 | — |
| UgandaUGA | 145 Per 100,000 population | 2016 | |
| ChadTCD | 52 Per 100,000 population | 2012 | — |
| Congo, Rep.COG | 49 Per 100,000 population | 2018 | — |
Source: World Bank (WB WDI)